
Key Points
- The NZ economy expanded by 0.6% over the 2017 December quarter – below what we, the market and the RBNZ had expected. On an annual basis GDP growth remained around trend at 2.9% yoy.
- Service sector activity was the main driver of growth over the quarter, in particular business services, wholesale trade, retail trade and transport services.
- The agriculture sector took a large hit to production as the hot and dry start to summer weighed on dairy production.
- December quarter GDP growth was only a touch below the RBNZ’s most recent forecast. As a result, we continue to expect that the RBNZ will keep the OCR unchanged until May 2019.
Summary
This morning’s GDP release showed the economy expanded 0.6% qoq at the end of 2017, the same as that seen in Q3 but weaker than what we, the market, and the RBNZ had expected. As a result, annual growth came in a 2.9% yoy, slightly higher than the 2.7% yoy recorded in September. The agriculture sector took a hit in the quarter following a hot and dry start to summer that hampered dairy production. We had expected that the improved production conditions at the start of the quarter would have gone someway to offset the tougher time for farmers experienced during December – this turned out not to be the case. But as expected, business-related services were a key driver of growth in the December quarter, particularly professional and scientific services, and are consistent with strong demand stemming from elevated population growth. We don’t think that today’s data release will worry the Reserve Bank too much as it remains broadly in line with their view that the economy is growing around trend in the near term. What is of more importance for monetary policy is where growth goes to from here.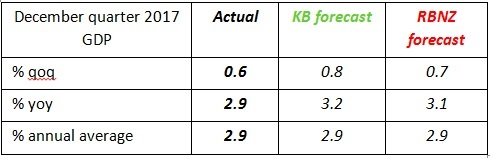
Looking ahead we see growth remain around trend (2.5-3% yoy) over the opening quarters of 2018 before economic growth once again strengthens. We will be looking to see if the disruption caused to agriculture production over the December quarter lingers at the start of 2018 – conditions have generally improved. In addition, the construction sector looks like it is once again facing capacity constraints limiting its contribution to growth in the first half of 2018. Further out, however, government spending is expected to play a key role, as the Government’s families package kicks in, and the Kiwibuild programme eventually gets underway. Our view is similar to that presented at the RBNZ’s February Monetary policy Statement (MPS), although we expect a slightly faster pickup in growth over the second half 2018 and into 2019. Nevertheless, the RBNZ is likely to be comfortable to sit on its hands for now, and wait until there are sustained increases in inflation before starting to hike the OCR. We expect the Bank to begin gradually hiking the OCR from May 2019.
Services activity behind December quarter growth
Service industries – especially business-related services – were the main drivers of GDP growth over the December quarter, while agriculture faced a challenging start to summer. Professional, scientific and technical services experienced a 2.3% quarterly lift in activity, up from 1% qoq recorded in the September quarter and the highest rate of growth in over a year. This likely reflects ongoing solid underlying demand in an economy that is experiencing rapid population growth, low interest rates, and a buoyant tourism sector. Rental, hiring and real estate services grew 0.8% qoq. This part of the economy broadly tracks activity in the housing market and Q4 activity is likely to reflect the gradual recovery seen in house sales over the second half of 2017. However, business services were not the only service sectors to experience respectable growth. Retail trade, wholesale trade, and transport services all grew at a decent tick and have been supporting annual growth for some time now (see chart below). Retailers looked to have benefited from a boost in household spending on food – both at supermarkets and dining out.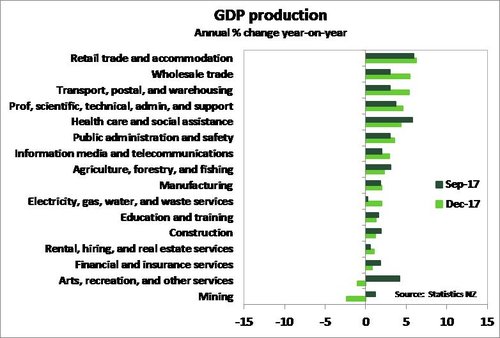
Dairy production dried up at the end of 2017 as an extremely dry and hot start to summer took its toll. Production in the agriculture sector fell 3.2% qoq, led by a fall in dairy production in December. We had expected that the improved production conditions at the start of the quarter would have gone someway to soften the hit taken in December, but this did not transpire. Fonterra had indicated that milk collection in December was down significantly (6%) on the same period in 2016. In addition, the tough conditions also weighed on sheep and beef farmers. Stock was sent to slaughter earlier than usual in the final quarter, likely to be in part due to farmers taking advantage of high prices, but also as farmers looked to take pressure off farms – contributing to less on-farm production. The fall in dairy production also flowed into weaker manufacturing activity (-0.1% qoq) as food production dragged the sector’s activity down.
Non-housing investment drives expenditure GDP growth
The expenditure measure of GDP grew 0.4% qoq, in line with our forecast, taking annual growth to 3% yoy. Expenditure GDP was driven by a solid lift in investment activity, both in non-residential building and plant and machinery, and private consumption expanded 1.2% qoq. Providing a drag was a fall in net exports as a notable lift in imports of goods and services outweighed a modest increase in exports over the quarter.
Per capita GDP softens while NZ’s purchasing power improves
On a per capita basis GDP growth expanded only 0.1% qoq in Q4, a touch lower than the 0.2% in September, but well down on rates of growth experienced in 2016. While headline growth tends to exceed per capita GDP growth, the gap between the two has widened in recent years (see chart below). This divergence suggests that much of the increase in GDP over this period has been driven largely by population growth (via net migration), rather than increases in productivity.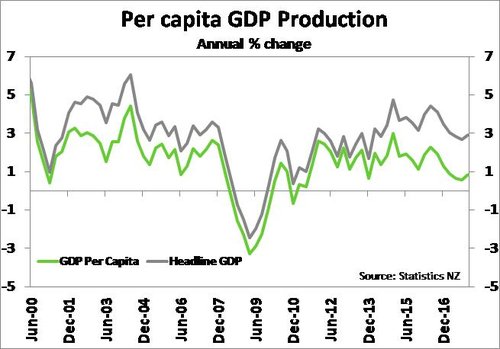
Despite the fall in per capita GDP growth, growth in NZ’s real gross national disposable income per capita (RGNDI) – which is essentially a measure of NZ’s purchasing power – managed a 0.9% qoq increase from 0.3% qoq in Q3. With population growth outstripping GDP growth in the quarter, the rise in RGNDI was largely the result of the record terms-of-trade seen in the December quarter. A stronger RGNDI represents a boost in wealth to NZ and is supportive of household consumption growth.
Policy implications
As mentioned above, today’s lower-than-expected GDP figures are not expected to worry the RBNZ too much as it shows an economy growing around trend – broadly in line with the Bank’s view expressed at the February MPS. Heading into next week’s March OCR Review (Thursday) the RBNZ is likely to feel generally comfortable with its economic outlook and its current policy stance. For instance, the global economy continues to show signs of strengthening, despite ongoing political risks – such as the Trump administration’s introduction of import tariffs. NZ’s trade-weighted exchange rate has been stubbornly high, but is in line with the RBNZ’s February MPS forecast. And since the February MPS the housing market has continued to gradually recover. As a result, we expect to see the Bank keep the OCR unchanged at 1.75% and only make minor tweaks to the one page statement next week.
Market reaction
The weaker-than-expected GDP numbers promoted a swift but muted response in currency markets. The NZD dropped 0.3% to a session low of $0.7304 immediately following the release of GDP figures – just above identified technical support at $0.7300. However, the currency has recovered virtually all the drop by early afternoon. Wholesale interest rates have had a volatile session, but largely unchanged overall. The 2-year swap rate is currently at 2.25% while the 5-year swap rate sits at 2.73%.