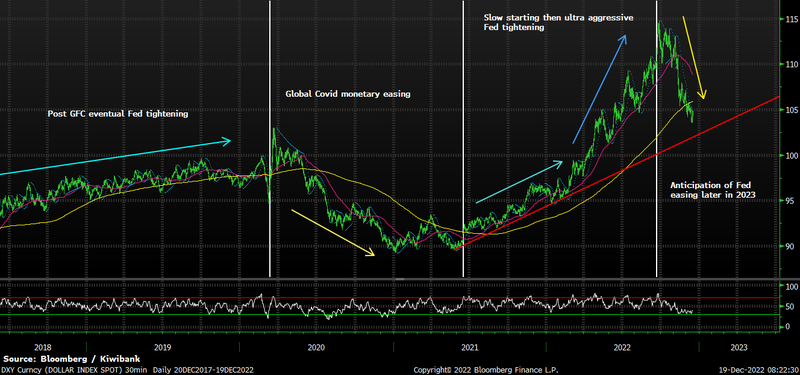
DXY 5 year daily – The story of the US Federal Reserve’s monetary policy cycle(s) on the US Dollar. Trend support level circa 102/102.50 will be key to watch for any resumption of US Dollar strength in this current period over the coming weeks.
- The expectation of central banks reducing the pace of monetary tightening has boosted confidence and risk appetite. The Kiwi dollar looks to be regaining momentum.
- Near-term, we see a helpful strengthening in the Kiwi dollar. Because the RBNZ is simply more aggressive on interest rate hikes, compared to the vast majority of central banks. Interest rate differentials are working in our favour, for now.
- The updraft in the Kiwi flyer, however, won’t last. As the world plunges into recession and commodity prices decline, we will most likely see the Kiwi currency spiralling lower. The Kiwi is likely to end 2023 lower.
The backdrop.
Back in August, the US Dollar looked to be losing momentum. The little Kiwi flyer (NZD) was primed for take-off. But how the tables turned. Global recession fears intensified and a flight to safety dominated financial markets. The Greenback returned to favour, setting off a fairly relentless selloff in the Kiwi dollar. From an August-high of around 0.6450, the Kiwi dollar fell to a low of 0.5560 by mid-October. More recently, the expectation (and delivery) of central banks reducing the pace of monetary tightening has boosted confidence and risk appetite. And the Kiwi looks to be regaining momentum. It seems that any excuse for the Kiwi to run higher is being taken, even in global risk off moments.
A key driver of the stronger Kiwi dollar has been the ultra-aggressive stance from the RBNZ. Most G10 central banks have softened their stance and stepped down from the big bold hikes of 50bps or more. Some have even hinted that they may be nearing the end of their tightening cycle (Bank of Canada). The RBNZ however continues to stick to their guns, highlighting the importance of getting a handle on inflation – sooner rather than later. At 7.2%, Kiwi inflation is unacceptably strong. And stubbornly high inflation expectations are questioning the RBNZ’s inflation-fighting credibility. Another 125bp of hikes to the cash rate, with a follow-up 75bp in February have been pencilled in.
We are still some ways from seeing a cooling in inflation in NZ. It certainly doesn’t help that the official data comes only quarterly. By comparison, the US Federal Reserve has now had two rounds of data confirming that US inflation is indeed reaching a turning point, and is beginning to cool. The luxury of such timely data has allowed the Fed to slow the pace of their tightening. And markets are one step ahead. Cuts to the Fed funds rate are already being priced in as early as the second half of 2023/early 2024. The end of tightening is in sight, and it’s having a marked impact on the US dollar. The current selloff in the USD is supporting commodity-linked currencies, like the NZD. And over the next three months, we expect that the Kiwi dollar will remain well supported into the 0.6500 territory and beyond – perhaps even into the 0.6700/0.6800 levels. Also supporting commodity currencies is China’s reopening. The world’s second largest economy is loosening its extremely strict covid restrictions. There is cautious optimism for growth in the (very) short-term.
Next year however is shaping up to be a tough one. 2022 saw central banks aggressively hike interest rates to squash multi-decade high inflation. And the higher rates will surely have the intended effect. That is, to slow spending and inhibit growth. Large parts of the global economy will fall into recession in 2023. We will see the impact of slowing global growth in our terms of trade – the ratio of export prices to import prices, reflecting our purchasing power. Our terms of trade is currently at record highs, since records began in 1861. But what goes up, must come down. The risks around the global outlook mean we will likely see export prices falling relative to import prices. And as a driver of the Kiwi flyer, a declining terms of trade over 2023 puts the NZD under pressure. We may even see a repeat of the Kiwi’s performance over the August-October months. The USD will be favoured once more as a safe haven currency. We may see the Kiwi head as low as 0.6150 again. However, we are some ways from reaching that point at the moment. Enjoy the sunshine while it lasts.
On the Kiwi/Aussie front, we see this as overbought at the present moment. Some consolidation is in order, but the cross will likely remain supported in the 0.9300/0.9350 area. Over the next couple of months, we expect NZDAUD will head into the 0.9500-0.9650 territory as the RBNZ/RBA divergence plays out. Beyond that, we will be looking at the impacts of the coming recession on the antipodean currencies. Given the Australian economy is perhaps slightly more resilient on the housing and earnings front, the Aussie dollar is more likely to be favoured.
An engineered recession.
The outlook for the global economy is worsening, and so too is the outlook for the Kiwi economy (see here). Indeed, the RBNZ is engineering a recession. Much higher interest rates are being set to reduce demand (namely household consumption) to better meet constrained supply. A better-balanced economy is needed to return inflation to target. But the sheer weight of rising interest rates is set to push the economy into recession next year. We’re forecasting a three-quarter contraction in activity from the June quarter to leave the economy 0.7% smaller at the end of 2023. Here are our key economic considerations for 2023:
- Inflation: is forecast to ease slowly over 2023. The recent rally in the NZ dollar and cooling global commodity prices will help lower the cost of imports. But stickier domestic inflation will take longer to tame. It will take until early 2024 for inflation to return to the RBNZ’s 1-3% target band.
- Labour market: will loosen, in time. As economic demand cools, so too will firms’ demand for labour. Firms will also have more choice as net migration inflows return and help plug staff shortages. The unemployment rate is set to track higher, and peak around 5.1% in 2024.
- Housing: continues in retreat. The decline in house prices has further to go as the RBNZ continues on its path to a 5.5% cash rate. Annual house price declines are expected to reach 14% in the first quarter of 2023, meaning a 21% drop from peak to trough.
Watch economic update: RBNZ stands alone
 Mary Jo Vergara (Economist) sits down with Belinda Newman (Head of Balance Sheet Management) to discuss the RBNZ’s historic cash rate hike, and the reaction in financial markets.
The statement was forceful and determined. Inflation rates are simply too high. And the credibility of the proud inflation-fighting central bank is being questioned. The OCR track – the RBNZ’s clearest signalling tool – was shunted higher to 5.5%. More interest rate hikes are likely.
See here for Kiwi Economics’ take on the RBNZ’s November 2022 Monetary Policy Statement: “Hike till it hurts, and then hike some more. And continue to hike even with a recession looming.”
Kiwi crosses in the months ahead.
NZDUSD
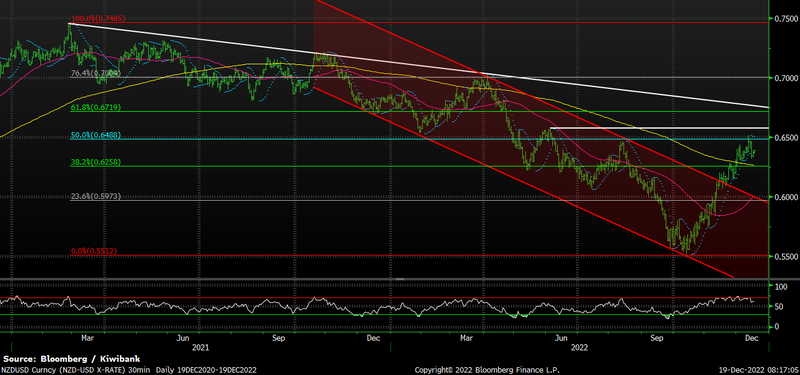
2-year daily – Strong recovery from October lows is running into resistance at the 50% retracement of the 2021-high (0.7465) and 2022-low (0.5512). Short-term consolidation towards the 200-day moving average at circa 0.6250. Such a move is not surprising given overbought momentum indicators. However, fundamentals can see a move towards 0.67(long term resistance and 61.8% Fibonacci retracement) develop before any major correction lower.
NZDAUD
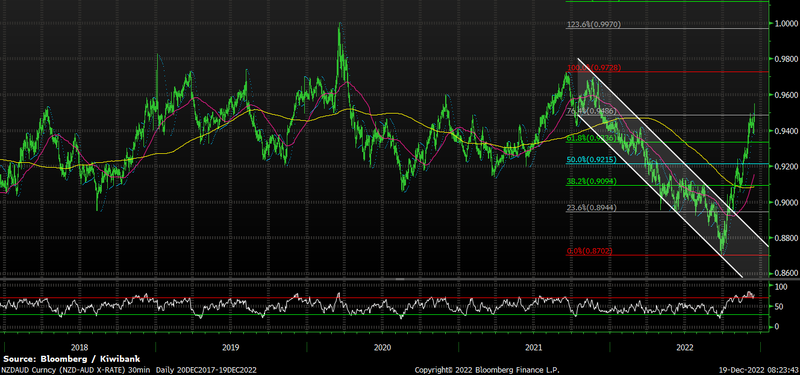
2-year daily – Differing tightening approaches by RBNZ and RBA mean interest rate differentials will drive NZD strength. Heavily overbought momentum indicator readings argue for a period of consolidation/short-term pullback from the recent high prior to a possible resumption towards the 2021 peak (0.9730).
NZDEUR
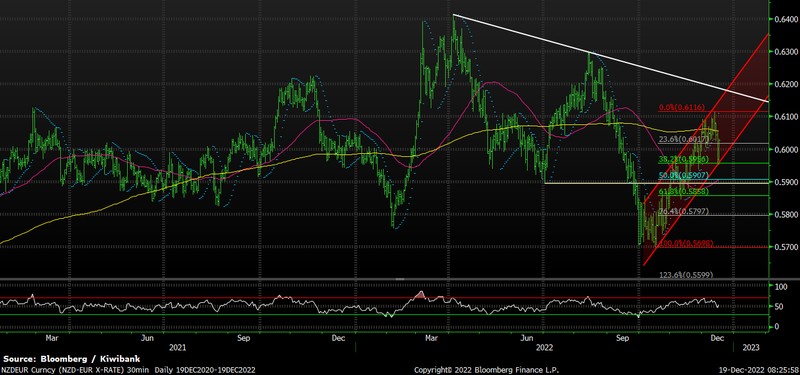
2-year daily – A test of uptrend channel support repelled in the past 48hrs. This channel support area represents good short-term EUR seller levels. Descending peaks from April 2022 are not constructive for the longer term picture above 0.63. Continued EUR performance will be driven out of the ongoing unwind of the strong USD story of early 2022. Should current trend support fail, expect moves towards 0.59 in the first instance. Conversely, 0.61 and then 0.6150 represents good upside value in the near term.
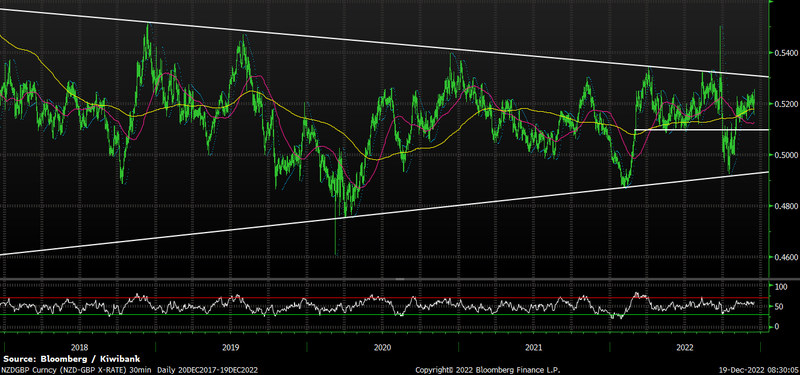
NZDGBP
5-year daily – The pattern continues to converge! Ignore the Sept 2022 breakout – the UK finally figured things out with their fiscal plans (for now). Technical picture remains a converging triangle range now between 0.4930 – 0.5300, with a pivot zone at 0.51. GBP buyers be active from 0.5250, sellers from below 0.5140 in the shorter term.
Glossary
Commodity currencies: include the Kiwi dollar, Aussie dollar, Canadian dollar, Norwegian krone as well as currencies of some developing nations like the Brazilian real. These countries export large amounts of commodities (raw materials like oil, metals and dairy) to the world. And commodity currencies are highly correlated with the global prices of such commodities. When the global economy is strong and demand for commodities is high, commodity prices and thus commodity currencies, tend to outperform. The Aussie and Kiwi dollars are famously known for the sensitivity to good news (risk on) and bad news (risk off).
Interest rate differentials: The difference between the interest rates earnt on two different currencies. New Zealand may offer a significantly higher interest rate than those in Japan, for example, and we see an inflow of Yen into Kiwi dollars (known as the “carry trade”). The widening, and narrowing, of interest rate differentials can have a material impact on capital flows and therefore the exchange rate.
Monetary hawk (hawkish) and Monetary dove (dovish): Characterisations of central bank monetary policy. The hawk is a bird of prey and describes a central bank aggressively raising interest rates to slow economic growth and tame the inflation beast. The peace-loving dove however, reflects a central bank trying to stimulate economic growth by cutting interest rates.
Moving averages: A common method used in technical analysis to smooth out price data by showing the average over various time periods.
Reserve currency: The US dollar is the global reserve currency. The dominance of the US dollar in international trade means most central banks and financial institutions hold amounts. The majority of FX reserves are held in US dollars. The US currency and debt markets are the most liquid in the world. And liquidity (the ability to buy and sell, especially in times of stress) is important. The next most traded currency is the Euro, but it is nowhere near as popular as the US dollar. About 60% of global reserves are held in dollars, with the Euro attracting only 20%, according to the IMF.
Support and Resistance levels: These are chart levels that appear to limit a currency’s price movement. A support level limits moves to the downside; a resistance level limits moves to the upside.
Terms of trade: The ratio of the prices at which a country sells its exports to the prices it pays for its imports. Put simply, terms of trade is a measure of a country’s purchasing power with the rest of the world. How many imports can be purchased per unit of exports – import bang per export buck. An increase in our terms of trade means New Zealand can purchase more import goods for the same quantity of exports. And a rising terms of trade lifts the incomes of exports and the businesses and communities that support them.