
Key Points
- The New Zealand economy expanded by 0.5% over the March quarter - weaker than market consensus, our forecasts, and the RBNZ’s view.
- Annual growth is now running at 2.5% yoy, marginally below trend growth. We expect GDP growth to remain at around trend over the next couple of quarters.
- Construction activity hit the skids in Q1, partly offsetting a rebound in agriculture production and manufacturing.
- Today’s data affirms that the RBNZ has plenty of time to wait and see how inflation pressures develop over the next year. We maintain our view that the RBNZ will leave the OCR unchanged at 1.75% through until late 2018.
Summary
The March quarter GDP data was weaker than expected at 0.5% qoq, taking annual GDP growth down to 2.5% yoy, from 2.7% at the end of 2016. This is the second quarter that growth has surprised on the downside and there is evidence that some industries (e.g. construction) are running into capacity constraints – limiting further growth potential. That said, the underlying momentum in the economy is expected to continue, add in a few areas where we should see a rebound in the June quarter, and you still get an about trend pace of growth. We expect to see the NZ economy continue to chug along at around trend (or slightly above it) over the next six months. Beyond that, there is a big questions mark about whether construction activity will be able to speed up again, or else we may see a more prolonged investment cycle play out over several years. 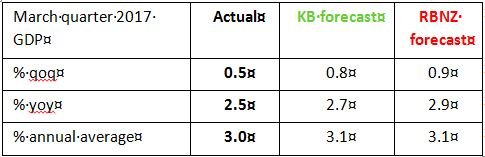
For the RBNZ, this means that the economy is likely to remain at around trend pace of growth rather than convincingly above trend (we estimate trend growth to currently be between 2.5-3% yoy). This compares with the RBNZ’s forecast that growth would reach a pace of close to 4% yoy this year. With a more muted pace of growth, we are unlikely to see the same extent of widespread domestic inflation pressure in the economy. However, we do still expect to see domestic price pressures build as consumption increases and firms feel more comfortable raising prices (as indicated by recent business surveys). In addition, headline inflation rates of around 2% are likely to prompt wage inflation to rise, particularly in a competitive labour market, and capacity constraints seen in industries such as construction continue to add pressure to prices. Today’s data supports our view that the RBNZ is likely to sit on its hands and keep the OCR unchanged at 1.75% for an extended period. We maintain our view that the RBNZ will not hike interest rates until late 2018.
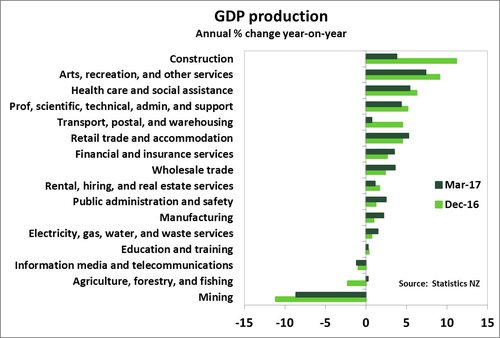
Dairy rebound offsets construction slump
After dairy production tanked at the start of the 2016/17 season, we have now seen a solid rebound in production volumes since the start of the year. This turnaround boosted agricultural production by 4.3% over the quarter, although we haven’t yet seen this feed through to materially higher food manufacturing. The boost from dairy was somewhat offset by a second consecutive quarterly decline in forestry and logging activity. Overall the agriculture, forestry and fishing sector has only managed to eke out a gain of 0.2% yoy.
Manufacturing did post a solid gain over the quarter of 1%, however the main driver of this was from transport, machinery and equipment manufacturing – rising 6.9% qoq.
On the downside, the clear standout for production growth was the construction sector. Production from all construction sub-groups fell over the quarter, taking the group down 2.1% qoq. Historically construction has been the part of NZ’s economy experiencing the strongest growth but the recent slowdown in house sales (particularly in Auckland) combined with rising costs and tighter credit conditions have seen residential construction volumes drop 5% over the past quarter. However, construction remains up 9.3% yoy and we expect the construction industry to pick up again across the board (residential, commercial and infrastructure) toward the end of the year.
Service sector moderating
The services sector (which comprises 70% of GDP production) was mixed at the start of 2017. In line with the slowdown in housing sales, we have seen a pullback in rental, hiring and real estate services, down 0.1% qoq, and up just 1.1% yoy – compared with growth of 4.6% over the year to March 2016.
The retail trade and accommodation group rose 1.8% qoq, in large part driven by motor vehicle and parts retailing. The vehicle industry also boosted wholesale trade (up 1.4% qoq) due to vehicle wholesale activity. As New Zealand’s population continues to both grow and age, demand for healthcare and social assistance services continues to lift, rising 1.6% at the start of 2017, to be 5.4% yoy.
Expenditure GDP growth limps in again
For the second consecutive quarter expenditure GDP growth limped in with a 0.2% qoq and follows a downwardly revised 0.1% qoq in Q4. Declines in exports and a downward contribution from inventories took the gloss off of a healthy rise in private consumption expenditure. On an annual basis, GDP grew 3.1% yoy but was influenced by downward revisions to previous GDP figures.
Despite weak headline growth, there were some bright spots in underlying expenditure GDP. Private consumption expanded 1.3% qoq to be 4.7% higher than the same period last year. Until fairly recently, consumption growth was surprisingly soft given a falling unemployment rate and rising wealth from outsized house price appreciation. Consumption seemed to be largely supported by rapid population growth. Over the last year per capita consumption has lifted averaging 2.5% yoy since June 2016, compared to 1.4% yoy over the two years prior. In the March quarter, households chose to splash out on durable goods (up 2.5% qoq) an in particular on used cars, which corresponds to a notable rise in the number of imported cars over the quarter.
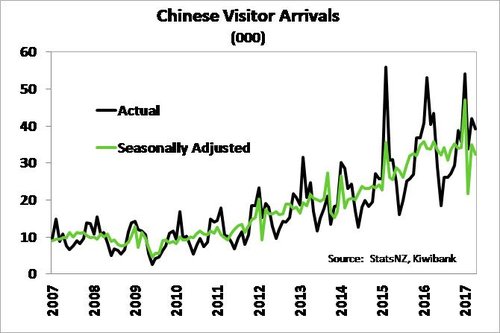 While private consumption supported GDP growth, net exports provided a bigger drag on GDP in the first quarter. Agricultural exports were down 1.1% qoq, with dairy exports recording the second consecutive quarterly drop of 11% qoq and follow a 7.8% qoq fall at the end of 2016. Weaker dairy exports are likely to reflect a delayed response to weaker production in the second half of 2016. We are expecting some payback in the coming quarters given Fonterra has already reported a notable increase in production since the start of the year. Also, dairy-related inventories were noted to have risen over the March quarter. Services exports barely registered a gain in Q1, up 0.1% qoq, with a 1.7% qoq fall in spending by overseas visitors. Chinese tourists have been a notable driver of spending by overseas visitors in recent years, and the timing of the Chinese lunar New-year holiday, at the end of January, looks to have thrown around the number of Chinese visitor arrivals during the March quarter. However, more importantly has been a flattening off in the trend of Chinese visitor arrivals over the last twelve months (see chart above), which may limit growth in export services over the year ahead.
Per capita GDP growth declines again
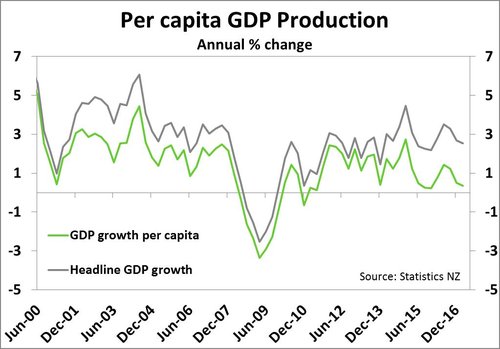 While there has historically been a gap between per capita GDP and headline GDP growth, the gap between these two items has been widening in recent years. Per capita GDP growth has fallen for the past two quarters as population growth has outstripped the pace of economic growth.
Market reaction
Offshore events overnight had caused an interesting start to the local trading session before the GDP data release. Weaker US CPI data had seen the NZD/USD rally about 70 points overnight to a high of $0.7320 before partially retracing gains following the US FOMC’s meeting decision. The Fed delivered a rate hike, as expected, and indicated that it is looking through near-term weaker inflation and sticking to its plan to gradually tighten monetary policy. There was little movement in the currency following the GDP data this morning.
In rates, it was a similar story, with offshore news having a much bigger effect on the local yield curve. The NZ curve followed offshore rates lower this morning with a sharper fall in the long-end seeing a flattening in the yield curve. The 2-year and 5-year swap rates were down around 3pts and 5pts to 2.17% and 2.65% respectively heading into the March quarter GDP data release. Market pricing for a rate hike from the RBNZ has pulled back marginally on the GDP data, although still has a full 25bp OCR hike priced in by August 2018.