
Key Points:
- The Consumers Price Index (CPI) data released this morning showed surprisingly soft inflation pressure over the June quarter. Prices were flat over the last three months, pulling headline inflation back from 2.2% in March to 1.7% yoy in June.
- The biggest drag was from the transport group, with a sharp decline in prices for domestic airfares as well a lower price tag for fuel. On the other side, another quarter of higher vegetable prices due to weather-related supply disruptions caused a jump in food costs.
- There were a few volatile components driving the data but core inflation measures also pulled back this quarter, suggesting some softening in price pressure.
- While we maintain our call for the RBNZ to start lifting the OCR from late 2018, if housing market activity fails to pick up again toward the end of this year then there is a downside risk to inflation and subsequently our OCR outlook.
Summary
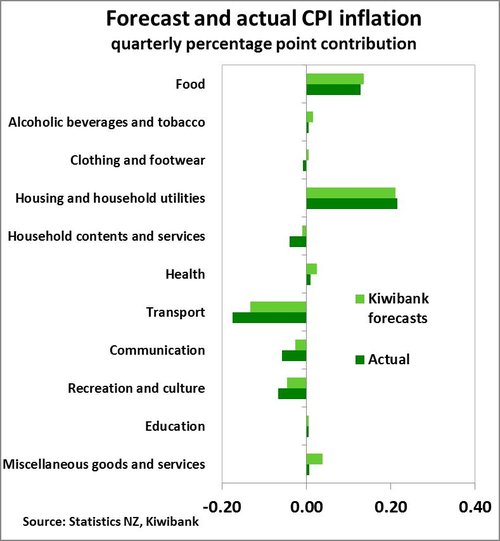 The June quarter CPI data was softer than we, market consensus, and the RBNZ had forecast, with prices flat over the June quarter. Annual inflation declined from 2.2% yoy in March, to 1.7% yoy in June 2017. Transport prices were the biggest drag over the quarter, driven by softer petrol prices and cheaper domestic airfares. Offsetting this weakness somewhat was higher prices for new housing and household utilities (electricity in particular).
Non-tradables (domestic) inflation increased 0.2% qoq (led by housing-related costs) but this was exactly offset by a 0.2% qoq decline in tradables inflation (due to weaker transport prices) – causing a 0% read for quarterly inflation. On an annual basis, non-tradables inflation pulled back slightly from 2.5% yoy in March, to 2.4% yoy in June, while tradables inflation experienced a much larger decline in the annual figure, from 1.6% yoy in March to 0.9% yoy in June.
For the RBNZ, the extent of domestic and core inflation will remain the key metrics to watch. Domestic inflation only pulled back marginally in today’s release, and although the turn in core measures is a little more concerning – it remains too soon to say whether this is a permanent or temporary phenomenon. In the RBNZ’s May Monetary Policy Statement (MPS) the Bank highlighted that “annual CPI inflation is projected to be volatile over the next year” – a view we agree with. In addition, the RBNZ is forecasting that annual inflation will decline to 1.1% yoy in March 2018 so they have already factored in some retracement from recent highs – although this appears to be happening earlier than anticipated.
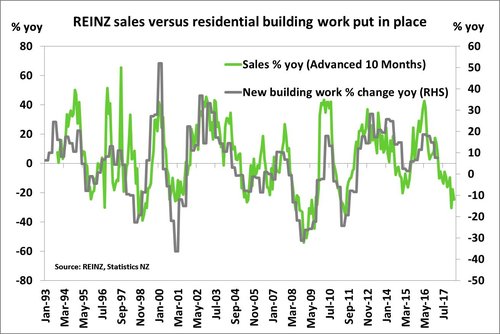
While growth in construction activity and housing sales have slowed, capacity pressures in the housing market are continuing to drive prices of new housing higher. For this story to change we would need to see demand fall and capacity constraints ease – a scenario we see as unlikely given the outlook for population growth and shortage of skilled workers in the building sector. We expect to see housing market activity pick-up again from late 2017 and with it, domestic inflation pressures are gradually expected to rise further. However, if this view proves wrong then we may need to adjust our OCR call to push back the timing of rate hikes. For now, we maintain our view that OCR hikes will likely be required from late-2018.
Domestic price pressure confined to housing
Non-tradables inflation, or domestic inflation, recorded a 0.2% qoq increase in the June quarter, less than the 0.4% qoq rise we had forecast. Once again housing-related prices, particularly for new housing, played a dominant role in domestic inflation. The housing and household utilities group experienced a 0.8% qoq rise in prices, underpinned by 1.8% rise in prices for new housing (excluding land). Auckland in particular experienced a 3% qoq rise in the cost of new builds and backs-up other evidence illustrating the rising bottlenecks faced by the construction sector. Rents were also a contributor to housing-related inflation, but increased at a more modest 0.4% qoq - not too far off increases seen in recent quarters.
 Partly offsetting the on-going rise in housing related prices was a 15% qoq fall in domestic airfares, the largest quarterly decline on record. A notable fall in domestic airfares in the June quarter looks to be part of a new seasonal pattern which has developed in recent years. Domestic airfares declined 10% qoq and 13% qoq in the second quarters of 2016, and 2015 respectively. Also adding a drag to non-tradables inflation were falls in prices of other tourism-related services, including an outsized 8% qoq seasonal fall in accommodation services (seasonally adjusted accommodation services were 1.6% qoq lower) and lower car rental charges. This appears at odds with solid tourist data we have seen and with the outlook for the tourism sector still upbeat, we expect these tourism-related prices to bounce as the sector ramps up for another season.
On an annual basis elevated housing costs are also a dominant driver of non-tradables inflation. However, the recent slowdown in the housing market could see domestic inflation cool if it becomes more prolonged than we are anticipating. House price appreciation has stalled on an annual basis in Auckland – where much of the increase in the cost of new housing is centred – and the number of house sales has fallen sharply in recent months.
Tradables inflation adding volatility
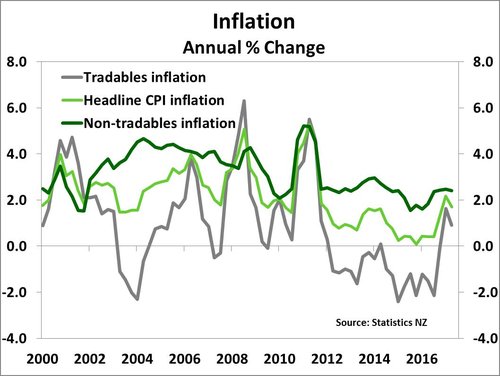 Offsetting the rise in non-tradables prices was weaker tradables inflation – driven by lower petrol prices, fruit and furnishings. Tradables inflation dropped 0.2% qoq, but remains 0.9% higher over the past year. Tradables inflation tends to be much more volatile than non-tradables and has driven sharp spikes in headline inflation in recent years – with oil prices and the NZD pushing tradables prices around. Petrol prices declined 1.9% over the June quarter, and with declines in prices amplified in the final few weeks of the quarter. If petrol prices remain at current levels (or lower) then that will cause another weak contribution from fuel in the September quarter (petrol accounts for 5% of the total CPI basket). While vegetable prices continued to move higher over the last three months, there was at least some relief for consumers through a 5% decline in fruit prices – driven by cheaper apples and grapes. With the housing market cooling, there are signs of softer demand for household furnishings with prices for these products declining 4% qoq. On the upside, international airfares were 3.7% higher over the quarter – in stark contrast to much weaker domestic airfares.
On an annual basis, tradables inflation remains firmly in positive territory at 0.9% yoy (slightly softer than our forecast of 1% yoy) – although has dropped from 1.6% yoy in March 2017. While petrol was lower in the quarter, it remains 4.5% higher for the year. In addition, the sharp increase in vegetable prices over the past two quarters (largely due to weather events) has seen prices for fresh vegetables increase 19% over the last year. We expect that as supply eventually normalises heading into spring that prices will start to normalise again and the recent price pressure will unwind. Again this is likely to add volatility to inflation data in coming quarters.
Core inflation softening
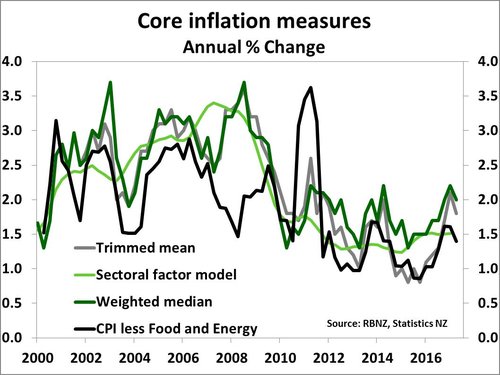 With headline inflation numbers remaining volatile it is worth taking a close look at underlying ‘core’ inflation measures. The headline decline in Statistics NZ’s trimmed mean measure (which strips out extreme price movements) was smaller – declining from 2.1% yoy in March to 1.8% yoy in June. However, this partly reverses the strong run of rising trimmed mean inflation seen in the last year. In addition, CPI (ex food and energy), which is another measure of core inflation – also declined from 1.6% yoy to 1.4% yoy. Overall, core measures of inflation all pulled back slightly over the June quarter. Whether or not this is a temporary or permanent slowdown remains to be seen. The RBNZ will release its sectoral factor model at 3pm today, but we expect it to remain flat at around 1.5% yoy.
Market Reaction
Today’s weaker CPI out-turn prompted a sharp response in both the NZ dollar and local wholesale interest rates. The NZD/USD initially declined 55 points to $0.7275, but has retraced those early losses on news that the US has failed to pass Trump’s healthcare reform bill. The local interest rate yield curve shifted down, with both the 2-year and 5-year swap rates down around 4bps to 2.21% and 2.78% respectively. In addition, OIS market pricing for the timing and extent of OCR hikes has pulled back, with the market priced for 25bps of hikes by August 2018 – down from 30bps prior to the release.