


- Kiwi inflation is running at 7.2%, down a smidge from 7.3%. The rate of inflation is well above forecast. And the outlook for price pressure is one of prickly persistence. Today’s report will be like a red rag to an inflation fighting bull. And we now expect the RBNZ to deliver an outsized hike of 75bps in November (previously 50bps).
- Imported inflation is cooling, but not as expected. And our domestically generated inflation is heating up. Local prices rose from an annual rate of 6.3% to 6.6%. A step in the wrong direction.
- Stronger for longer inflation will force interest rates higher for longer. We now expect the RBNZ to lift the OCR to 5%, up from 4%.
Kiwi inflation is running hot. Price pressure far exceeds market expectations and interest rates will be forced higher in response. The headline rate of inflation eased a touch from 7.3% to 7.2%, after a stronger than expected 2.2% gain on the third quarter (Kiwibank 1.7%, consensus 1.5%). Inflation is running well above the RBNZ’s forecasts. Today’s report will be like a red rag to an inflation fighting bull. We have no choice but to expect a more aggressive RBNZ response. The CPI report was a shocker, to put it politely.
As expected, food and housing were the main contributors. But the report was much stronger than expected across the board. Stripping away the volatile prices movements in food and energy, core inflation accelerated from 6.1%yoy to 6.3%yoy.
Inflation emanating out of housing and construction continues to surprise on the high side. And we were surprised by the strength in imported inflation. Annual tradables (imported) inflation fell from 8.7% to 8.1%, although we were forecasting a fall to 7.1%. Prices in the transport category rose (we expected a fall) despite a decline in petrol prices, as airfares rose 20%.
Domestic price pressures were also clear. Unlike imported inflation which may have turned the corner, domestic inflation continued to climb. Housing-related costs underpinned the rise, with the construction of new dwellings up 16.8% over the year. Overall, non-tradables rose to 6.3%yoy, setting a new record high.
Broad-based gains.
Food and housing were at the helm of the quarterly lift in prices. But all main groups, bar one (communication), posted price gains as inflation continues to broaden. In fact 66% of all items in the CPI basket recorded an increase in prices. That proportion continued to climb, and is currently at a record high.
Food prices rose 4.1% in the quarter which is the fastest quarterly increase since the GST increase in 1989. Driving food prices higher was the 17% increase in fruit and veges. Annually food prices are sitting at a shocking 13-year high, up 8%. Vegetables prices alone rose 24%. It’s a seasonal spike, albeit exacerbated by the recent adverse weather. Altogether, the food group was the largest contributor in the quarter, adding 0.73%pts to the headline print.
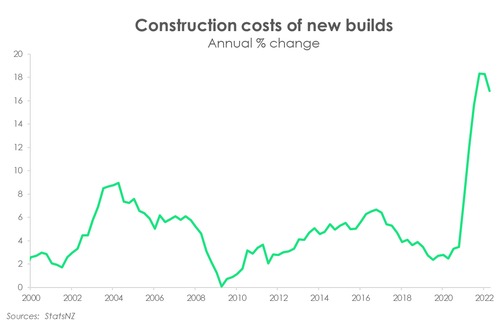 The 2.3% increase in housing-related inflation was the second largest contributor to September quarter inflation, adding 0.64%pts. Though on an annual basis, the 8.7% increase in housing was the top contributor. And underpinning the rise was the 16.8% increase in home construction costs. There’s no denying the serious capacity constraints that the construction sector continues to face. These acute shortages continue to drive up home construction costs, up 3.3%qoq. Home building remains a costly business. Also adding to the mix was the usual rise in annual council rate increases. Stats NZ estimates a 7.3% annual increase. Rents also lifted, up 4.6% annually which is the highest since 1991.
Petrol prices did fall in the quarter by 4.5%, as expected. Global growth fears have intensified in recent months, and it’s dampening appetite for commodities. Global oil prices, in particular, tumbled around 20% since the beginning of July. And local petrol prices have reflected the drop. But the decline was offset by a 20% increase in international airfares in the quarter alone. StatsNZ increased the weights of some components within the transport group to reflect the fact the Kiwi are travelling more (both at home and abroad) as covid restrictions have receded. Overall, the transport group posted a 1.7% increase in prices.
The September quarter also showed the pass through of the cost pressures onto the retail level. According to NZIER’s latest QSBO survey, a net 74% of firms experienced rising costs in the period. And these cost pressures continue to feed through to the retail level. The QSBO also revealed over half of retailers reported to have increased their prices over the last three months. The September quarter saw strong price rises for imported consumer goods including clothing and footwear (1.2%), as well as household contents and furnishings (1.6%). The December quarter could see these prices push higher given the recent decline in the Kiwi currency.
Domestic inflation continued to climb.
Tradable (imported) inflation slowed from 8.7%yoy to 8.1%yoy. Petrol prices may have declined over the quarter, but are 18.8% higher over the year. Rising food prices are also to blame. We continue to import inflation from offshore. Of the 7.2% annual increase in prices, 46% of the move (or 3.23%pts) was driven by tradables, which is an outsized move given its ~40% weight.
The growing strength of domestically generated inflation however is of greater concern. Because it’s the kind of inflation that’s harder to tame. And unlike tradables, domestic inflation continued to climb. Non-tradable inflation rose from 6.3% to 6.6%, 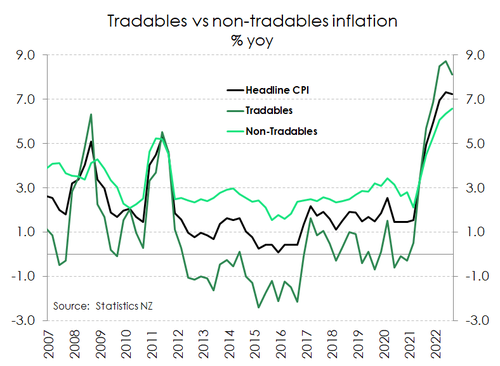 marking a new record high – note non-tradeble number only goes back to 1999. Housing-related costs continues to underpin domestic inflation, with the rise in home construction costs still in double-digits. The September quarter also included annual council rate rises. This year rates were 7.3% higher, that was a touch higher than the sizable 7.1% jump of 2021. We may have reached the peak in housing-related inflation. The supply disruption that has dogged the construction sector for the last year or two look to be easing. Shipping costs are falling and with a housing market clearly in retreat, demand should start to ease.
While tradables inflation is big in terms of contribution to total inflation, non-tradables is still bigger – something the RBNZ will be worried about. Around 53.9% of the annual jump in prices was driven by non-tradables (or 3.79%pts).
Core inflation worryingly high.
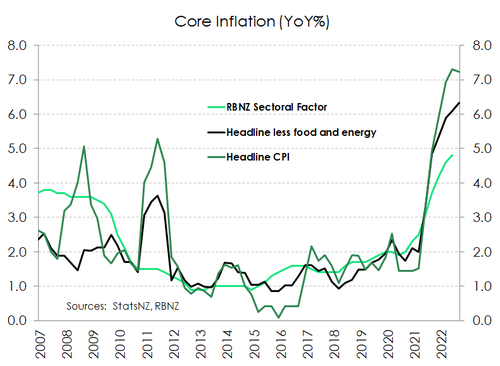 Strip out volatile price movements, that’s price moves both up and down, and you’re left with measures of core inflation. And core inflation remained uncomfortably high in the September quarter. Headline inflation excluding food and energy (a common international measure of core inflation) lifted further to 6.3% - again a new high. Moreover, StatsNZ’s trimmed mean measures generally lifted coming in at between 6.4% - 7%. The September quarter included plenty of extreme movements. Somewhat of a consolation, the quarterly movement the trimmed-mean measures actually eased from around 1.8% to 1.4%. The RBNZ’s own core measure released later today is odds on to lift higher too.
Nevertheless, core inflation is too high. And underscores the stubbornness of the current bout of inflation. It’s likely to be a slow road for the RBNZ back to the 2% target. The strong rise in non-tradables inflation (mentioned above), the part of the CPI basket the RBNZ has the most influence via monetary policy, must come down.
Where to from here?
The path for inflation looks to be downhill from here. Several indicators suggest that the pressure on global supply chains has eased materially in recent months. Global shipping costs have firmly turned south, and capacity is expanding with more ships being built. However, it’s a long way back to 2% with the Kiwi currency slowing the return. Due to a late start from the US Fed, and therefore relatively more aggressive tightening at present (as well as subdued risk sentiment), the USD has strengthened significantly. A weaker NZD however sets a roadblock for the descent in tradables (imported) inflation. It may take longer than expected, and hoped, for imported inflation to normalise.
The stickiness of non-tradables inflation also extends the journey back to a 2% inflation rate. We expect non-tradables (domestically generated) inflation to fall next quarter as the council rate increases would have washed through. However, domestic inflation pressure remains well supported by the surprising resilience of the economy. Our own spending data shows that household consumption is still holding up, despite the rising interest rate and high inflation environment. We are also yet to see the peak in wage growth. The labour market is expected to remain tight, especially as the net migration outflow deepens. Hiring intentions remain robust. And the only conclusion is rising wages.
More rate rises are required for the RBNZ to rein in inflation. We expect another 150bps of hikes to come. Resilient demand and a weakening Kiwi dollar is frustrating the outlook for inflation.
The downside risks to economic growth however are mounting. The forward-looking indicators are showing a significant slowdown in growth. Both business and consumer confidence has been hit hard, and the housing market is in full retreat. The global outlook too is weakening.
A hard landing is likely and will feel like a recession.
The risks of a global recession are rising. The more central banks are forced to tighten, the more likely we are to see a recession. The IMF have recently revised their global growth forecasts lower, again. For 2023, global growth is forecast to be just 2.7%, with “many economies” facing recession. The sharp slowdown in global growth means the risks to financial stability are “exceptionally high”, and the worst is yet to come.
“The 2023 slowdown will be broad-based, with countries accounting for about one-third of the global economy poised to contract this year or next. The three largest economies, the United States, China, and the euro area will continue to stall. Overall, this year’s shocks will re-open economic wounds that were only partially healed post-pandemic. In short, the worst is yet to come and, for many people, 2023 will feel like a recession.” (IMF, October 2022)
The weakening global backdrop is particularly awkward for Australia and New Zealand. Our largest trading partner, China, is struggling. The zero-Covid policy is causing huge disruption. Chinese authorities continue to state that the war against Covid is “winnable” through strict lockdowns. Although at some stage the severe impact on economic activity might just force change. Furthermore, China’s property market crisis is causing contagion throughout the economy. House prices are falling in nearly three-quarters of China’s largest cities. China’s property market has helped fuel investment throughout the economy. No more.
New Zealand’s trading partner growth is slowing, quickly, and commodity prices are falling. New Zealand is a very small, open economy heavily influenced by global growth and developments in financial markets. The deterioration in the global growth outlook will only soften the outlook for Aotearoa.
Financial markets are expecting more, and more.
Global interest rates continue to rise, as central banks are forced to fight inflation. The US Fed is centre stage, with US inflation coming in stronger than expected. Market traders have factored in a 5% Fed funds rate, delivered in a series of 75bp moves. The Kiwi rates market is merely keeping pace with the US. Our wholesale interest rates incorporate a terminal rate of a little over 5% (similar to the Fed). And in line with our upwardly revised expectation of 5%.
As expectations for rate rises rise, the wholesale interest rate curve continues to flatten. And we expect the curve to flatten further. Short term interest rates are being propelled higher by central bank tightening. And longer-term rates must (partially) reflect a deteriorating growth outlook.
Kiwi swap rates catapulted higher as the CPI report was digested. The Kiwi curve bear-flattened as short term rates rose faster than longer term rates. The all-important 2-year swap rate jumped 20bps from 5.0% to 5.20% in a heartbeat. Whereas the 10-year swap rate rose 8bps to 4.85%. The curve flattened, as to be expected. The surprising strength in inflation, and likely path for interest rates, means mortgage rates have further to rise.