

- Net migration has surged spectacularly. From a 19,000 annual net outflow in early 2022 to a net inflow of 72,000. And the peak is likely to be 95k-100k. But we think it’s largely a story of pent-up demand. We should see flows ease back over the coming year.
- Migrants come here to create a better life for their families. And most of them work (hard) to fulfil their dreams. We are importing workers aged between 20 and 34. A fountain of youth for an ageing population.
- Today’s mix of migrants may be less inflationary than in previous episodes. We expect the current migration boom to exert more downward pressure on wages, than it will add to aggregate demand and inflation.
Net migration has surged spectacularly. In the span of just 12 months, we’ve gone from an annual net outflow of 19,300 to an annual net inflow of 72,300. Truly a surge of breakneck speed. The Aotearoa ‘brand’ has performed remarkably well throughout the pandemic, and we should never underestimate our international pulling power. We had an above consensus forecast of +36,000, and even we were found short. Aotearoa is, and should always be, an attractive destination. It should be noted that the data is subject to significant revisions, in both directions. But for the here and now, the data paint a rapid recovery from when Covid prompted a border shutdown.
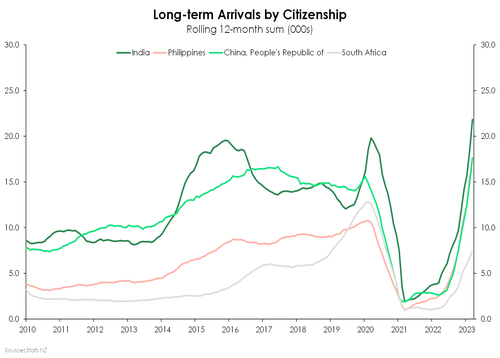 Long-term arrivals have been on a steep climb. And non-NZ migrants are at the front of the queues. In the year to April 2023, we recorded a net gain of 98,400 non-NZ citizens. Like pre-Covid trends, most have arrived from India, Philippines, China, and South Africa. Over 27,000 Kiwi returned home, but that was more than offset by the almost 54,000 Kiwi leaving the burrow. As is typical, a net loss of 26,100 NZ citizens over the last year was recorded. That’s larger than the 5,000 average net loss in 2015-19, but smaller than the 29,000 average net loss between 2005 and 2014. In the early 2000s, we were a team of about 4.2mil. Today, we’re a team of 5.2mil. The 26k (net) outbound Kiwi makes up a slightly smaller proportion of total population this time around.
Nonetheless, long-term departures appear to have stabilised in the second half of last year. We expect the same for arrivals, in time. We think the surge in net migration is largely catchup from the pandemic. Migrants whose plans to come to NZ were stymied by Covid border restrictions are coming now. We think migrant flows will naturally fall back. On a quarterly basis, we believe we’re nearing peak net inflows. Annually, net migration is still climbing. We’re on track to hit 95-100k later this year. That’s a lot, but it’s largely baked in. Given the big gains over the past few quarters, we’re more than halfway there.
We expect net migration to ease back to around 35,000-40,000, marginally higher than our previous forecast. That would still be well below the average of the five years preceding Covid (close to a 60,000 net inflow). It is difficult to compare to the pre-Covid period as the 2014-19 period was the largest migration boom in recent history. Nevertheless, falling back to 35k-40k reflects tighter immigration settings and strong competition from other developed countries for skilled migrants.
The breakdown.
Let’s start with the long-term flow of Kiwi across the border. A key influence is the relative strength of NZ’s labour market compared to major emigration destinations – like Australia and the UK. For instance, the Aussie mining boom of the early 2010s attracted many Kiwi across the Tasman. And at that time, the Kiwi economy was still hurting from the fallout of the 2008 financial crisis.
The pull of work is a powerful one when it comes to migration flows. Since Covid-related border restrictions were relaxed in 2022, we have seen an exodus of Kiwi heading offshore. The exodus was in part due to the pent-up desire of many young Kiwi to see the world. And the world has been crying out for Kiwi workers.
As the chart below shows, the Australian labour market has tightened faster than NZ’s over the past year. At the same time, we have witnessed a return to net outflows of Kiwi offshore. We expect the Aussie labour market to retain its relative strength 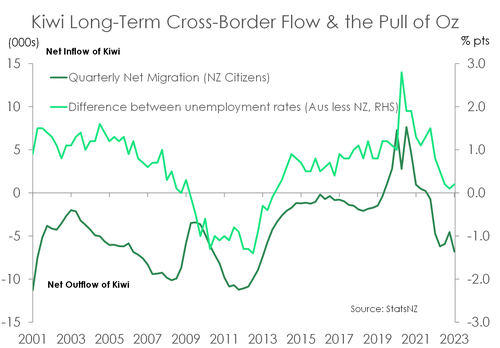 over the coming months. The relative story is also a monetary policy one. The RBNZ has been far more aggressive than the RBA in slowing the economy. The RBA has so far raised rates by 400bp, far fewer than the RBNZ’s 525bp. The RBA also began tightening policy just a year ago, seven months after the RBNZ. As a result, we could see our economy slow much faster than the Aussie economy. And our unemployment rate may rise faster than that of our Antipodean counterpart. A measurable outflow of Kiwi – bigger than pre-covid levels – is likely to persist for the foreseeable future.
More than offsetting the net outflow of Kiwi is a sharp, sharp rise in non-NZ net migration. There is a solid desire to come to Aotearoa at present and this is reflected in the spike in arrivals. We are now recording an annual non-NZ net gain well in excess of 95,000. That’s a remarkable turnaround from the net loss of 12,100 in April last year.
We were always expecting the return of migrants once the border restrictions were removed. Worldwide searches on Google for “NZ visa” and related terms have skyrocketed since our border reopened (see chart below). We recognise that an online 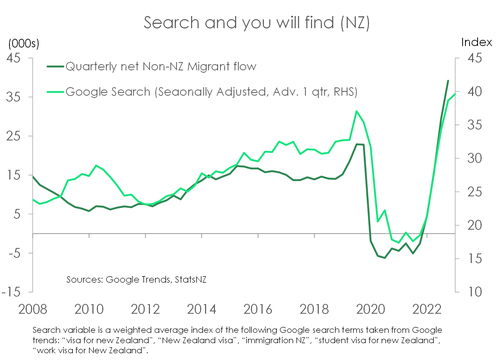 search is a long way from actually moving to NZ. Some of these search terms simply reflect the desire to travel, not necessarily the willingness to live in NZ. And for some countries, such as China, they are underrepresented in the data. In China, homegrown search engines are more widely used than Google.
Nevertheless, the data signals a sizable desire to move to our corner of the world. We may see a continued increase in non-NZ migrant flows ahead. But we think we’re nearing peak load. We are picking quarterly net non-NZ inflows will top out at these levels (~40k), before easing to ~20K (a little above pre-Covid levels) at the end of the year.
Just as spectacular as the rise in migration, so too the fall back to pre-covid levels will likely be. Immigration settings are more restrictive than what was in place over much of the 2010s. Also, NZ is competing with other developed countries for skilled migrants. The net result of these forces means we are 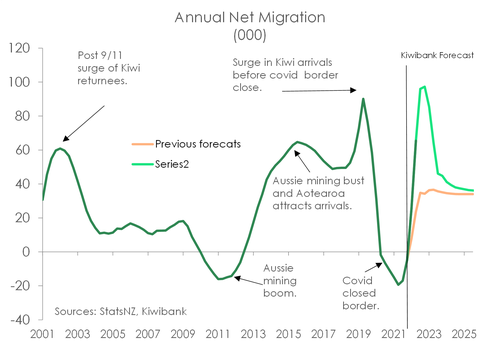 expecting a surge in annual net migration numbers to around 95k-100k by the second half of 2023, before settling to an average of between 35,000-40,000.
A much-needed boost to capacity.
Net migration booms add to both the demand and supply sides of the economy. Previous booms, particularly in the early-mid 2000s, caused a much more significant increase in the demand for goods and services. The same will play out today – to some extent. Yes, more people mean more of everything including the need for more houses. In fact, we are already seeing tentative signs of recovery in the housing market, as migrants play a larger role. And all of this extra demand typically means more inflation.
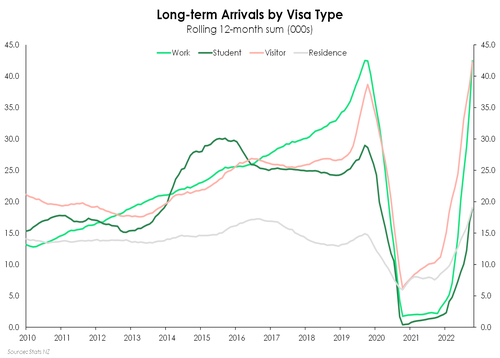 However, we don’t think this current boom will be as inflationary as one might expect. Principally because rising net migration is helping to increase the capacity of the economy – more than it is adding to aggregate demand. As we saw in the latest labour market update, the participation rate rose to a newly printed high of 72% with the resurgence in migration. Migrants come here at a working age, and they are keen to work. Indeed, in the last 12 months, over 40% of the net gain in migrants was concentrated within the 20-34-year age bracket. Arrivals on student visas are also steadily rising. And international students studying here typically move into the workforce (as most student visas allow up to 20 hours of work per week). Migrants are a fountain of youth, and employment. The boost in labour supply is plugging the staffing gaps that have long-plagued firms in this covid era.
 Large gains in net migration also act as a weight on wage growth. Because migrants generally turn up and accept the going wage rate, and they are now arriving as demand for labour is beginning to soften. So first and foremost, net migration is helping to cool the inflationary pressures stemming from the labour market.
Another likely reason for a less inflationary boom is the occupational composition of migrants. The top occupations of those coming to our shores are not the highest paid. The top 10 occupations are concentrated in the services sector, particularly hospitality and trades. And that’s great news. Sectors across the board have been screaming out for workers, but hospitality, horticulture and construction have been among the loudest. Food trade workers – think chefs, cooks and butchers – have climbed to the top spot, up from being fourth place in 2015 (previous boom). While Architects, Designers, Planners & Surveyors have fallen to the 20th spot, down from 12th place. And Scientists and Health & Welfare workers have been replaced by Labourers (construction and mining). Yes, there’s a lot of 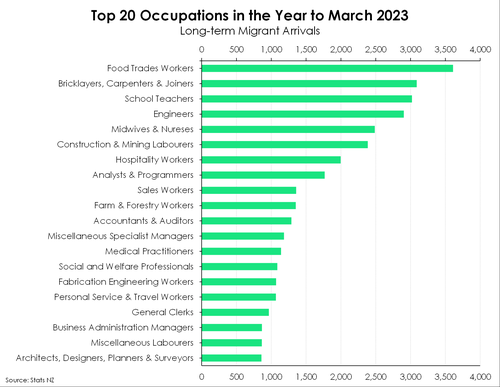 people coming to NZ. But with the flow of migrants toward these occupations, the consumption and thus inflationary impulse, may be weaker than we’ve previously witnessed. There are early signs in support of this. For instance, the May retail card spend was undeniably soft with a near-2% monthly decline. And that’s despite the increases to migration.
Overall, we think the addition to supply (labour) that comes with a gain in migration will likely outweigh the addition to demand. And on balance, that generates less inflation pressure than seen in previous booms.
The question for the RBNZ is: Does the migration boom justify further rate hikes? We don’t think so. We expect to see migrant flows settling back to pre-Covid levels. Such growth is simply pent-up demand. And such growth is simply unsustainable.