

The Grinch does his best to spoil Christmas, but New Year’s resolutions are upbeat.

Image source: 1957, 2018 Dr. Seuss Enterprises, LP.
The kiwi economy is growing at 2.6%, not 2.8%.
Key Points
- NZ’s economic growth slowed in the September quarter, gaining just 0.3%qoq and 2.6%yoy.
- There was some payback from the very strong 2Q reading, and some surprising weakness.
- The main downside surprise was in construction.
- We see strength in Q4, and above trend growth in 2019-20. And hopefully (business) heads start to lift.
- We also cover the US Fed’s decision in the markets section below.
Summary
The economy took a bit of a breather over the September quarter, growth slowed to 0.3%qoq following the impressive 1%qoq seen in June. That’s the slowest rate of growth since the December quarter of 2013. Annual growth also slowed to 2.6%yoy towards the lower end of estimates of NZ’s potential growth. The result was well below market and RBNZ estimates.
In our view the third quarter slowdown in growth is a temporary development. And we see economic growth accelerating through 2019. We have a Government that will deliver more spending next year, mortgage rates are near historically low levels – the RBNZ is not likely to lift anytime soon either – and the labour market is decidedly strong helping to support household spending activity. Even the consistently downbeat business confidence surveys are looking brighter. On Tuesday, ANZ’s Business Outlook survey showed a rise in firms’ outlook of own activity.
Industries that build stuff fall the most
Looking at the detail, a cooldown was felt most in the goods producing industries of the economy. In what was a surprise for us, construction sector activity fell 0.8%qoq. Building consents data had suggested a decent rise following flat activity over the first half of 2018. However, it was what building consents data does not capture that led to the contraction. Civil engineering activity drove the fall as the rebuild work on state-highway 1 around Kaikōura further wound down. Construction activity is down 0.6% yoy, but the pipeline of building work is long. Manufacturing activity also experienced a 0.8%qoq dip. Business confidence and manufacturing surveys weren’t all that flash over the middle of the year. Fortunately, forward indicators of manufacturing activity, such as the BusinessNZ Performance of Manufacturing Index (PMI) have turned a corner suggesting the slowdown in production is not likely to intensify.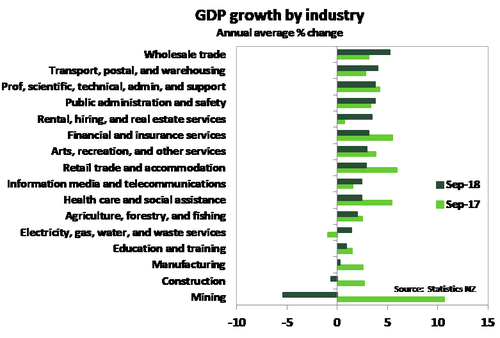
Services sector activity posted a modest 0.5%qoq rise, but underlying activity was mixed. Retail trade activity barely grew. A jump in petrol prices caused consumers to pullback spending on discretionary items. Petrol prices have since plunged, so again, the 3Q knock to spending should be temporary.
But some of the softness in the third quarter was expected, reflecting payback from the stellar second quarter. Primary sector production was particularly strong over the June quarter, and there was a slight fall in agriculture production in Q3. However, a jump in forestry production helped to put a slight sheen on primary sector activity. As expected the mining sector had a mighty 12%qoq rise in activity as the Pohokura gas field resumed supply in July. However, the field was shut down again in late September – a problem likely to be captured in December quarter figures.
Spending in the economy also grew more slowly in Q3
The expenditure measure of GDP – you remember, the C+I+G+(X-M) equation from first-year economics – also recorded slower growth in the third quarter. Expenditure GDP came in at 0.5%qoq from the 1.1%qoq measured in the prior quarter. The fall in construction activity in production GDP fed through into a sharp 0.9% fall in investment activity. Also of note, was a drop in plant and machinery investment that also contributed to lower investment activity. Private consumption growth held steady at 1.0%qoq. Spending on services and durable goods was decent in Q3. However, spending on non-durables saw a modest 0.2%qoq rise, and coincides with a sharp rise in petrol prices over the quarter. Net exports made only a minor positive contribution to growth.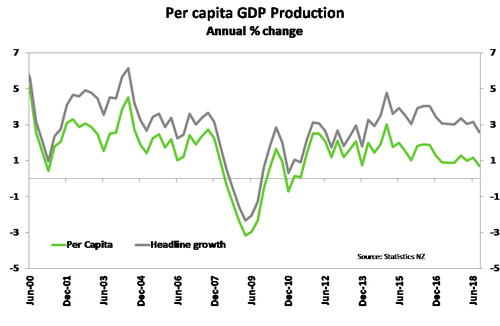
Per-capita growth is another highlight
On a per capita basis, GDP growth was flat over the quarter. The gap between headline and per capita growth has narrowed of late. This is a clear illustration of the impact the boom in net migration of recent years has had on headline growth. Net migration is easing, with 61,800 net long-term arrivals coming into NZ in the year to October, down 8,980 from a year earlier. So, population growth will not be making as much of a contribution to growth in the quarters ahead. Productivity growth will need to take up the slack. StatsNZ also publishes measures of the purchasing power of NZ’s income, and this improved in the third quarter. Real gross disposable income (RGNDI) was up 0.9%qoq.
The US Fed disappointed the market, giving the Kiwi a kick
Earlier this morning, the US Federal Reserve hiked the funds rate 25bps to 2.25-2.5%, as expected. The commentary was more neutral, but not dovish enough for market participants. The FOMC shaved their growth and inflation forecasts, and lowered their (in)famous dot plots – a plot of individual member expectations for the Fed funds rate out to 2021 and includes a “longer-run” estimate. Importantly for markets, the FOMC lowered their dot plot for 2019 from 3 additional hikes to 2. So the top of the band will likely end 2019 at 3%. Such a forecast, if delivered, inverts the US yield curve. For an explanation on why this is important, see our Top 10 things to watch in 2019, number 2. Basically, an inverted interest rate curve has been a good leading indicator of future recessions.
The Fed has acknowledged this risk, asking traders if they prefer more Fed funds hikes, or a faster run-off in the Fed’s money-printed mammoth of a balance sheet. I think the answer is obvious, and we’ll see a pause in Fed rate hikes, and a roll-off in their balance sheet to help stabilise the curve.
The FOMC’s median forecast unemployment rate was lifted 0.1%pt to 3.6% in n2020 and 3.8% in 2021 – still a very strong expectation. The core inflation (PCE) forecast was shaved 0.1%pt to 2%. Whereas growth was shaved in 2019 only, leaving 2020 and 2021 unchanged at 2 and 1.8% respectively (but slightly tweaking the range of expected outcomes lower).
Why do we care? Well financial markets were disappointed with the neutral tone, they wanted more fear. Unfortunately, central banks rarely show fear. So the US interest rate curve flattened – telling the Fed the market’s pundits believe they’re heading for a mistake in tightening too much. And of course, equities fell. Investors fear the dip-feed of cheap money has come to an end. Oh, and Trump’s stimulus is waning in impact – it was a sugar rush. The somewhat saving grace is the fall in Oil (petrol) prices, that should boost consumer discretionary spend.
Being the reactionary currency that it is, the Kiwi dollar fell immediately on the Fed’s decision. The Kiwi was down from 0.6860ish before the Fed’s announcement to 0.67895ish just before the Kiwi GDP report. The Kiwi GDP report gave the Kiwi another kick lower to 0.6779 at time of writing. The Kiwi was too high to start with.
Market Reaction
Interest rate markets are lower, with the implied probability of rate CUTS (not hikes) increasing. The 2-year swap rate is at 2.0%, and could break a little lower into the 1.90s. Mortgage rates are likely to remain lower into 2019, until we get a full handle on the RBNZ’s new capital requirements for banks.