
Key Points:- Consumer prices over the March quarter increased 1.0% qoq, slightly above our own forecast of a 0.9% qoq increase and higher than the market consensus of 0.8% qoq.
- This took annual inflation up to a rate of 2.2% yoy from 1.3% yoy in 2016, and nicely back to the midpoint of the RBNZ’s 1-3% target inflation range. We expect to see inflation remain well contained around 2% going forward.
- While there were many temporary factors driving today’s spike in inflation, there were also signs of solid underlying domestic price pressure that we expect to continue.
- Based on a combination of factors, including today’s CPI data, we have brought forward our expectation for an OCR hike from the RBNZ from mid-2019 to late-2018.
Summary
Today’s CPI data showed that headline inflation is now comfortably back at the middle of the RBNZ’s 1-3% inflation target range at 2.2% yoy.
The data outturn was slightly stronger than our inflation forecast (0.9% qoq, 2.1% yoy) and above market consensus for a 2% annual inflation rate. In addition, inflation is now tracking well above the RBNZ’s forecast from the February Monetary Policy Statement (MPS) which had inflation at 1.5% yoy at the start of 2017. The RBNZ was also forecasting that inflation would slow down again to 1.3% yoy at the end of this year which now looks unlikely given a higher starting point, the decline in the NZ TWI (trade-weighted index) in recent months, and more sustained underlying price pressures.
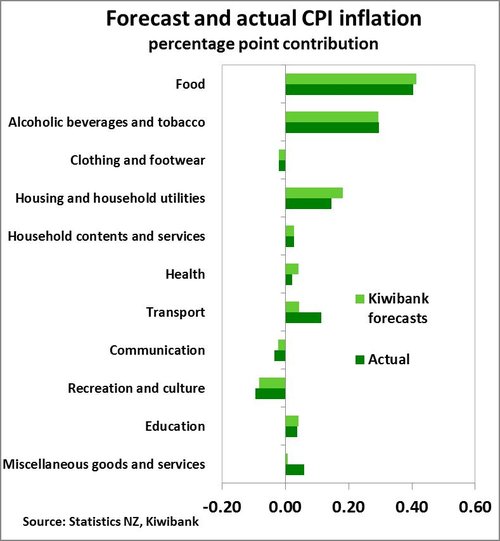
The March quarter CPI data was characterised by some temporary and seasonal factors including a sharp increase in fruit and dairy prices, a rebound in oil prices, as well as a hike in cigarette and tobacco excise tax. However, there were some signs of underlying price pressure coming through on the domestic front, with nine of the eleven subgroups experiencing positive price gains over the past year. In addition, the trimmed mean measure – which excludes extreme price movements – still had annual inflation at just above 2% yoy, indicating underlying price pressure after some major one-offs are accounted for.
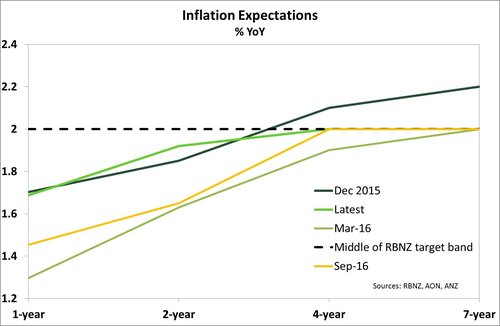 With headline inflation back at around 2% yoy, there is now much less risk of inflation expectations falling – one of the RBNZ’s primary concerns when it recommenced cutting the OCR at the start of 2016 – and in fact inflation expectations are likely to move higher in response to stronger headline inflation. In addition, with headline inflation running at 2.2% yoy and wages increasing by 1.6% yoy, employees may well start demanding wage hikes in order to compensate for the higher cost of living, which in turn can push domestic prices higher.
Today’s CPI data provides growing evidence that inflation pressures are becoming more widespread and sustained. As a result, we have brought forward our call regarding the timing of the next OCR move. We now expect the RBNZ to start lifting the OCR toward the end of 2018, around six months earlier than we previously expected. This is also six months earlier than the RBNZ had signaled in the February MPS.
With headline inflation now running at 2.2% yoy, it would be easy to argue that the RBNZ is looking down the barrel of OCR hikes in the near future (the view of financial markets is for a hike by March 2018). However, we see several reasons that argue for caution against that view. In particular, what matters most for the RBNZ is not that inflation is at 2% now, but ensuring that inflation is likely to remain between 1-3% over the next few years. At this stage, we see limited risk of inflation overshooting this target range on the upside in the near future. We expect inflation to remain well contained around 2% and the RBNZ to look through temporary forces pushing inflation around (as they have done in the past). Given New Zealand’s current stage in the economic cycle and the indebtedness of NZ households, we also see a risk that if the RBNZ starts lifting the OCR too soon, then they may end up backtracking on those hikes later on, as happened following OCR hikes over 2014/15. In addition, we have already seen some de facto tightening in monetary policy conditions with retail deposit and mortgage rates moving higher in response to rising wholesale interest rates and competitive pressures in the banking sector – which is doing some of the RBNZ’s work for it by tightening financial conditions. Overall the RBNZ still has time to sit on its hands and ensure the economy continues to experience solid growth – just a little less time than we previously thought.
Underlying price pressure driven by building industry
While a temporary increase in food prices was the largest inflation driver in the March quarter (see below), on an annual basis it is clear to see the upward price pressure coming through from the construction sector. The ‘housing and household utilities’ group rose 3.3% over the past year, contributing 0.8% points to the headline CPI increase of 2.2% yoy. Unsurprisingly the biggest price increase in the housing sector has been in the cost of new homes (excluding land) which is increasing at a rate of 6.7% yoy – the fastest pace seen since mid-2005. Strong demand for housing (particularly in the upper North Island), a shortage of builders, and rising costs of building materials are pressuring the cost of new homes higher. Those areas where housing demand has been highest are experiencing the strongest price increases, with the cost of new homes up 8% yoy in Auckland and 7.5% yoy across the North Island. The South Island has seen new home prices increase by a more restrained 4% yoy. With net migration expected to remain strong (despite the recent government announcements regarding migration policy) and building consents starting to pullback, we expect demand for housing will continue to put upward pressure on prices related to the construction industry.
On the other hand, rent increases remain more subdued – rising by 2.3% yoy. Geographic dispersion in housing costs is again clear, with rents in Auckland rising 3.1% yoy, while rent prices in Canterbury have fallen 0.8% yoy. There were also price increases in other areas which are experiencing demand pressure such as healthcare. With a growing population, we have seen demand for healthcare services pick up and we are seeing prices respond to this, rising 2.7% yoy.
Only two out of the eleven CPI sub-groups experienced a decline in prices over the last year – communications and recreation. The main downward drag on prices continues to come from the communications sector, where the price of mobile phone and broadband plans falling at the same time as the quality and speed of the service has improved. Telecommunications equipment prices have dropped 16.5% yoy, taking the overall communication group prices down 3.1% on an annual basis. Recreation prices fell 0.2% over the past year on the back of cheaper technology and package holidays.
Prices pumped up by some temporary movements
Some of the increase in March quarter CPI inflation was due to temporary and seasonal price increases. For instance, food prices increased 2.2% in the March quarter to be the largest contributor to March quarter inflation. Much of the rise in food prices was due to unseasonably high fresh fruit and vegetable prices, with fruit prices up 16% qoq. Apples in particular experienced a steep price rise due to a delay in new season supply in the quarter – a hangover from a late start to the growing season. There were also increases in the price of other produce such as dairy goods– in response to the strengthening of global dairy prices over the second half of 2016. Recent adverse weather conditions have added further disruption to the supply of fresh produce over the June quarter to date, which could see prices remain elevated in coming months, but ultimately we expect recent price gains to be transitory as crop yields return to normal levels over the second half of this year.
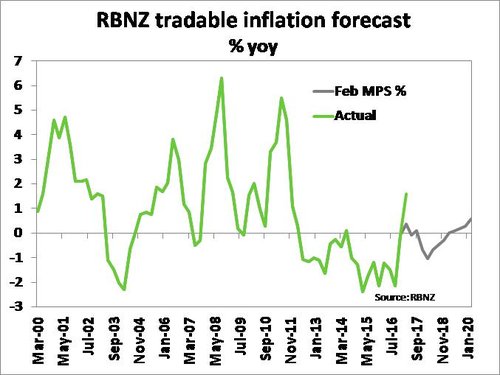 Another temporary factor driving inflation was a rebound in oil prices that have fed through to higher petrol prices. Petrol prices added to a stronger rise in the transport group than we had been expecting (+0.8% qoq vs. 0.4% qoq). It was not only petrol prices that led to a stronger-than-expected lift in the transport group, but also a solid 2.8% rise in passenger transport services. However, it was on an annual basis where petrol prices really dominated, posting a 12% yoy increase and contributing to a 3.5% yoy rise in the transport group and a 1.6% yoy increase in tradables inflation. Oil prices reached a record low in February 2016 of around US$26/barrel and have since rebounded to be trading around US$50/barrel currently. Oil prices have been pushed around in the past few months as a result of elevated US stockpiles and geo-political risks, which are likely to limit near-term petrol prices gains (movements in the NZD aside).
Since 2011, March quarter inflation has been subjected to a significant increase in tobacco excise tax increases and 2017 was no exception. Tobacco excise was increased by 10% from January 1, over and above usual inflation adjustment. As a result, the alcoholic beverage and tobacco group experienced a 4% qoq rise.
While we anticipate some payback from the sharp increase in food prices and petrol in coming quarters, the recent decline in the NZ TWI is expected to boost tradables inflation over the second half of 2017. Over the June quarter to date, the NZ TWI is now 3.4% below the RBNZ’s forecast which, all else equal, will mean the RBNZ is likely to revise up its tradables inflation forecasts in the next policy statement on May 11.
Market Reaction
Today’s CPI data was stronger than the market consensus expectation of a 2% inflation rate and the market responded positively to the news. Interest rates had already been pressured higher on the open this morning, but the NZD/USD jumped up around 40 points. The NZ TWI is now trading around 76.70.
Following the CPI data, the OIS market is again fully priced for a 25bps OCR hike by March 2018, with an additional two hikes (i.e. an OCR of 2.50%) by February 2019. In our view this pricing remains too aggressive given the factors discussed above.