
Key Points:- Employment jumped 1.2% over the March quarter, beating market expectations.
- The participation rate again reached a new record high, rising to 70.6%.
- However, employment growth was strong enough to outweigh the increase in the number people searching for jobs, taking the unemployment rate down to 4.9% from 5.2% previously.
- Wage growth remains soft at 1.6% yoy overall.
- For the RBNZ, today’s data printed in-line with its February MPS forecasts. We maintain our view that the OCR will remain on hold until late 2018.
Summary
Today’s labour market data from Statistics NZ showed a surprise decline in the unemployment rate, dropping from 5.2% at the end of 2016 down to 4.9% in March 2017. Based on the Household Labour Force Survey (HLFS), the number of people employed in NZ increased by a very solid 1.2% qoq (stronger than the 0.7% qoq gain we forecast). However, much of this strength was due to a rising number of people reporting themselves as self-employed (see below for details) rather than gains in those working for an employer. Looking at the Quarterly Employment Survey (QES), also released this morning, shows that the number of filled jobs reported by employers (excludes those self-employed) increased by a more muted 0.3% qoq – up 2.4% yoy.
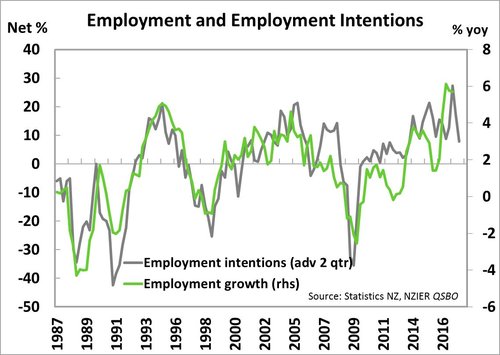
The number of those who are self-employed can tend to be quite a volatile series and we see some risk that this number could swing back in the opposite direction in the June quarter. A more subdued underlying rate of employment growth would tie-in with a lack of wage inflation we have seen in recent quarters. Overall wage growth has remained steady at 1.6% yoy, while private sector wage inflation actually declined slightly to 1.5% yoy. If employment growth can continue to outpace population growth in coming quarters, we would expect to see wage growth pick up over the next couple of years – particularly as headline inflation has moved higher. However, we continue to see a risk that employment growth fails to keep pace a rising number of job seekers in the years ahead, particularly as employment intentions in local business surveys appear to have pulled back more recently.
Today’s data does little to alter our view on monetary policy settings in NZ as we head into the RBNZ’s next OCR decision on May 11. We maintain our call that the OCR will be on hold until late 2018. We will release a full preview of the RBNZ’s May Monetary Policy Statement (MPS) later this week.
Strong surprise in employment growth, but details mixed
Headline employment growth of 1.2% over the March quarter was stronger than all analysts’ forecasts and meant that, even as labour force participation reached a new record high, employment growth outstripped gains in the labour force, causing the unemployment rate to fall. Labour force participation reached a new all-time record high of 70.6%, beating last quarter’s previous record of 70.5%. With net migration also continuing to run at record highs we have seen a 2.6% increase in the working age population over the past year, but encouragingly employment opportunities are continuing to absorb the growing amount of people seeking work.
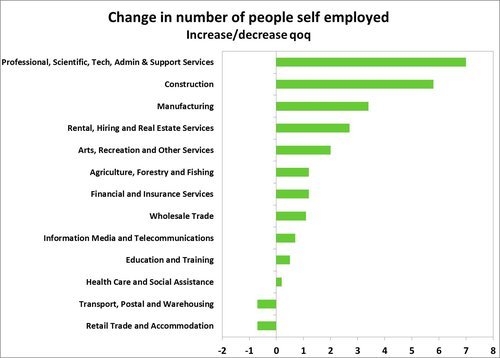 As noted above, a large share of the increase in those employed in the March quarter was due to rising numbers of people reporting themselves as self-employed. Of the 29,000 increase in employment, 27,700 reported themselves as self-employed (an 8.9% qoq increase). The increase came across a range of industries, with the biggest self-employment gains in the ‘professional, scientific, technical, admin and support services’ group, the construction industry, and in manufacturing. Given the sectors that self-employment has been concentrated in (e.g professional services and construction) it appears that the choice to be self-employed may reflect growing demand in those sectors and people taking the opportunity to accrue profits to themselves rather than their employers. However, reported self-employment numbers tend to be very volatile and today’s data just emphasises that point. As such we see a risk that self-employment could retrace its gains and instead decline next quarter. Whether or not that decreases overall employment levels will depend on these people finding alternative employment, or dropping out of the workforce all together.
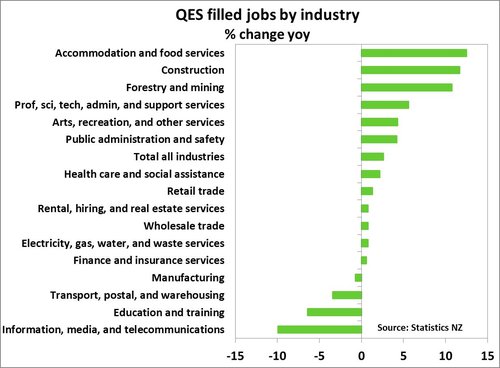 In the QES report, employment growth as reported by employers looks much more muted at 0.3% qoq, and is only 2.4% higher year-on-year. Statistics NZ also noted that if the HLFS employment data was adjusted to reflect the difference in scope between the two surveys, then HLFS employment growth would have only been a more muted 0.5% qoq. The breakdown of unadjusted filled jobs from the QES report shows that the biggest employment gains have been concentrated in those areas where we are seeing the strongest economic growth. Job opportunities in accommodation and food services have risen 12.5% yoy as the tourism industry continues to expand. In addition, the construction sector continues to be a large employer with an 11.7% increase in the number of people employed. Although there appears to be a little less competition for workers with wage growth easing slightly in the sector (see below for details).
First fall in real wages since late 2011
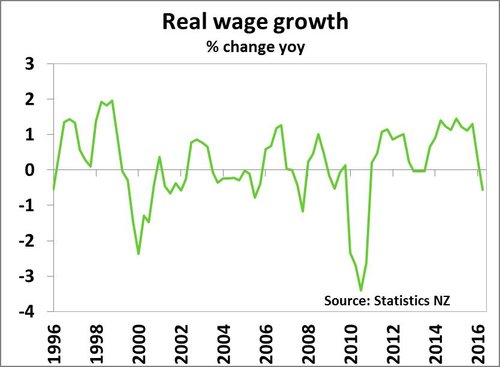
Wage growth remains muted despite rising labour demand and well documented skill shortages in certain industries such as construction and IT. Total wage growth, as measured by the quality-adjusted Labour Cost Index (LCI), came in at 1.6% yoy, which for the first time since the 2011 September quarter was short of annual CPI inflation over the same period (+2.2% yoy). This suggests that real wages fell 0.6% over the year to March 2017 (see chart below). Note that annual CPI inflation received a large boost in 2010/11 due to the last GST increase – which pushed real wages lower temporarily.
 Once again quarterly private sector wage growth came in at 0.4% qoq rise – the seventh consecutive quarter – to take annual wage growth to 1.5% yoy. Meanwhile, public sector wage growth was a little more robust at 1.7% yoy, but that was also lower than the previous quarter at 1.8% yoy. By industry, a surprise to see was a slight pullback in wage growth within the construction sector, which recorded a 1.8% yoy increase in the unadjusted LCI, from 2.1% yoy seen at the end of 2016. While some might point the finger at Canterbury as construction work there winds down, ex-Canterbury construction-related wage growth also eased. The QES measure of average hourly earnings, albeit up on the December quarter, was also fairly subdued recording a 1.6% yoy rise.
A hint as to why wage growth remains lacklustre could be seen in the reasons put forward by firms to explain wage increases. Of those employees that increased wages, only 25% noted that matching market rates, and/or attracting or retaining staff was a reason for undertaking wage rises – the lowest share on record. This result is at odds with other data that suggest firms are finding it increasingly difficult to fill positions. Interestingly, 59% of respondents noted that the cost of living was a reason for putting through pay rises (a survey high).
Policy implications
For the RBNZ, today's data are likely to be too late to incorporate into their latest set of forecasts for the May MPS (forecasts are usually finalised about 10-14 days ahead of the MPS). However, the unemployment rate and wage growth actually printed in-line with the RBNZ’s February MPS forecasts. While the headline numbers suggest a tightening labour market with strong employment growth and a declining unemployment rate, the breakdown of the data hints that the underlying story isn’t quite as convincing.
We continue to expect the unemployment rate to remain around 5% over 2017 as rapid population growth keep the supply of available employees elevated while employment intentions of firms appear to be pulling back somewhat. This is in contrast to the RBNZ’s view that has the unemployment rate will decline to 4.5% by March 2018. A lack of wage growth is likely to keep a lid on household spending, particularly with real wage growth turning negative. This in combination with rising mortgage rates and a flattening housing market in Auckland could see consumption growth at a more subdued pace than that seen over 2016. With inflation pressures remaining concentrated in certain pockets of the economy (e.g. construction and tourism industries), rather than broad-based price increases, we see no rush to increase the OCR in the near-term. We maintain our view that the RBNZ is likely to leave the OCR on hold until toward the end of 2018. A full preview of the RBNZ’s May MPS will be released later this week.
Market reaction
The better-than-expected headline unemployment rate reinforced the already positive NZD sentiment in the market. After declining from US$0.70 to around US$0.6860 at the end of April, the NZD/USD exchange rate has rallied back to around $0.6950 following a good GlobalDairyTrade (GDT) auction result last night and today’s data. The NZ dollar has also rallied against several of the other major crosses, taking the NZ TWI back up to 75.60.
The reaction in local interest rate markets has been much more subdued. The benchmark 2-year swap rate remains almost unchanged at 2.30%. Market pricing for the extent of OCR hikes has also remained static, with one full hike just less than fully priced by March 2018 – at least six months ahead of our own view.
You can sign up to receive our publications direct to your inbox by clicking here. You can also now follow us on twitter @kiwieconomics.