Key points
- Kiwibank electronic card spend contracted 7% in the March quarter. But it’s not a surprise to see soft spending to start the year. It’s payback for the holiday-fuelled lift in spending at the end of 2023. Over the December quarter, spend on all things food, retail and travel lifted 5%. Spending contracted in January and February, bringing down the entire quarter, but began to rebound in March.
- The volume of spend however reveals a bleaker truth. While the total dollars spent grew over the quarter, the total number of transactions shrank – down 4%. With high inflation and rising interest rates, Kiwi households are clearly reluctant to spend. And we will likely see more of the same in the coming quarters. We’re (still) spending more to(still) get less.
- Indeed, annual comparisons continue to show inflation working behind the scenes. Consumer prices, in aggregate, continue to rise (albeit at a slower pace) which in turn is inflating the total dollars spent – up 4%. The number of transactions however continues to track largely sideways, up just 0.3%.
- Over the quarter, Kiwi directed their dollars and cents to services over goods. The value of spend on services rose 1.5%, while spend on goods declined 10%. At the same time, consumer goods posted a big decline in terms of volumes, down 5%. We suspect some discounting in the retail space – due to overstocked levels – was also at play.
- Financial conditions are tight, and household disposable incomes are being squeezed. Consumer prices are high, credit is expensive, and consumer confidence is subdued. As households cut back on spending, it’s discretionary items that are being culled from the budget.
- The outlook for household spending remains broadly unchanged. Alongside still-high inflation and subdued consumer confidence, there’s plenty weighing on household consumption. However, the return of migrants offers a lifeline. Strong population growth should support aggregate consumption.
Interesting insights:
- The volume of spend on entertainment and recreation lifted in the quarter. Spend on movies and events is up 5% compared to last year. Between New Year’s in January and Easter in March, it appears Kiwi preferred recreation over retail during the new year – festivals, concerts (unfortunately not Taylor Swift), and sport events.
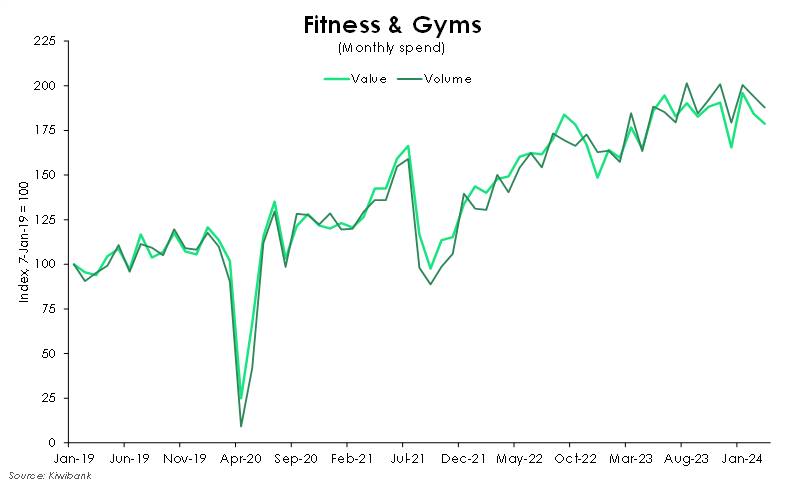
- The March quarter saw a typical lift in the volume of spend on fitness services and gym memberships. After a few weeks of indulgence, it’s time to get started on those new year’s resolutions
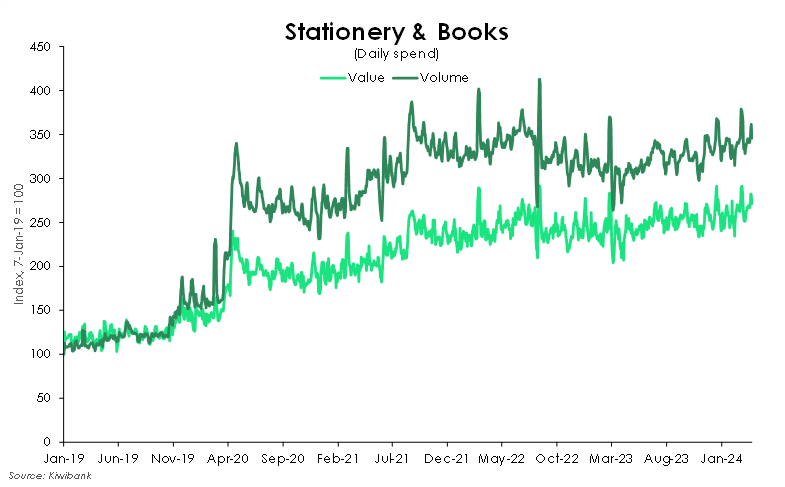
- Unlike most spend categories, the volume of spend exceeds the value of spend at stationery and book stores. Bookflation topped 12.5% but volumes are sitting comfortably above total value spent.
- Over January and February, public transport spend was softer than usual. Compared to pre-holiday levels, the average monthly volume of spend was down 8%. But March madness and the return to work/study saw a solid 5.2% rebound in spend – and a crammed commute.
- Flight booking spend rebounded in the March quarter. After a 15% drop in the volume of spend on flights in the December quarter, spend jumped 33% at the start of the new year. Compared to last year’s levels, both the value and volume of spend rose. The number of bookings purchased is up 4.7%, albeit slightly outpaced by the 7% growth in the value of the bookings made.
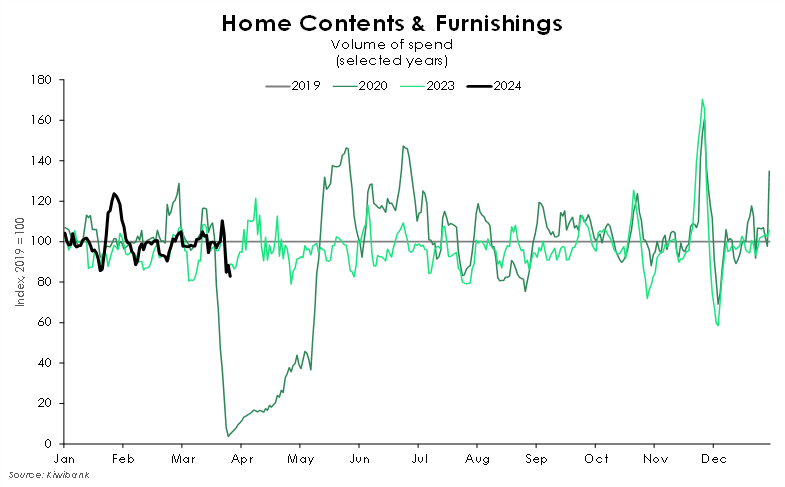
- Weakness in housing-related spend continued over the quarter, but there are signs of life. The average monthly volume of spend on home contents and furnishings now sits around 0.2% below pre-covid levels. However, this is an improvement from 2023’s levels where the average monthly volumes sat 7% below pre-covid. The improvement is likely one driven by population growth as financial conditions remain tight.
Seasonally soft spend.
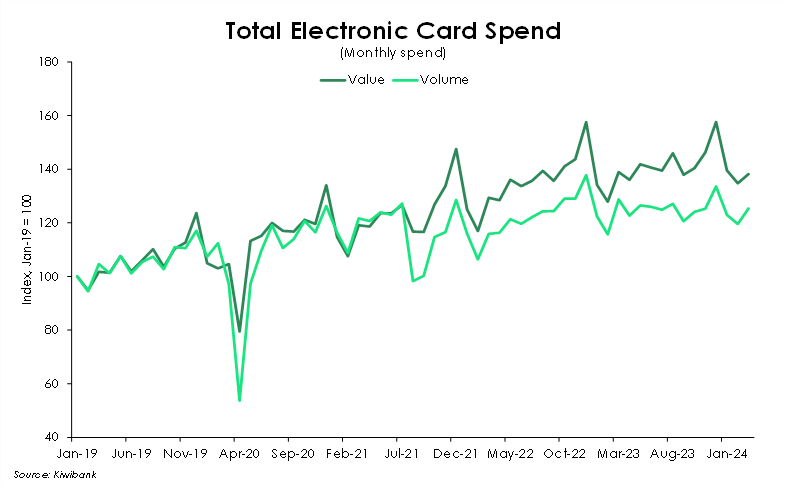
- Kiwibank electronic card spend contracted 7% in the March quarter. But it’s not a surprise to see soft spending to start the year. It’s payback for the holiday-fuelled surge in spending. Over the December quarter, spend on all things food, retail and travel lifted 5%. Spending contracted in January and February, bringing down the entire quarter. Spend however began to rebound in March.
- Against pre-covid spending levels, it appears that both value and volumes of spend remain elevated. It’s evidence of a growing Kiwibank customer base. The covid era has also shifted preferences away from cash and toward contactless forms of payment – whether online or ‘tap and go’ style.
- Inflation also continues to work behind the scenes. Consumer prices, in aggregate, continue to rise (albeit at a slower pace) which in turn is inflating the total dollars spent. The more sideways movement in the total volumes reveals a bleaker truth. The total number of transactions made were near-unchanged compared to last year, up just 0.3%.
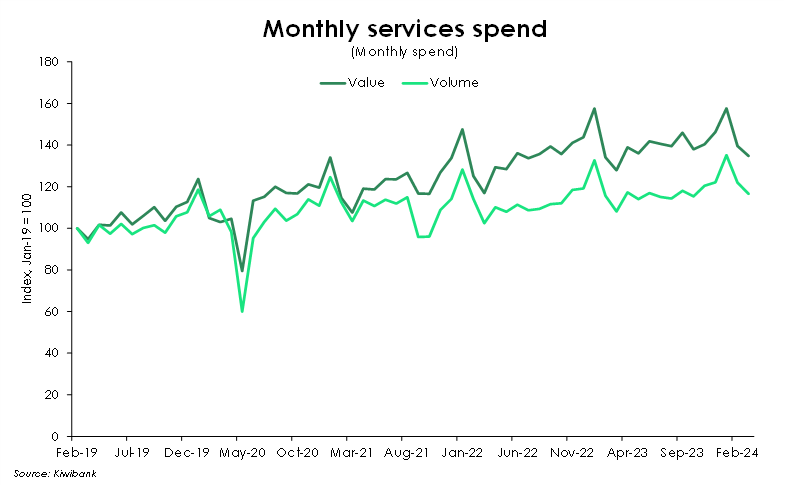
- Services was the highlight this quarter, with increases in the volume of spend on entertainment and recreation (next slide). Compared to last year however, the value of spend on services is down 0.4% with an even deeper drop in volumes (down 8%).
Recreation reigns.
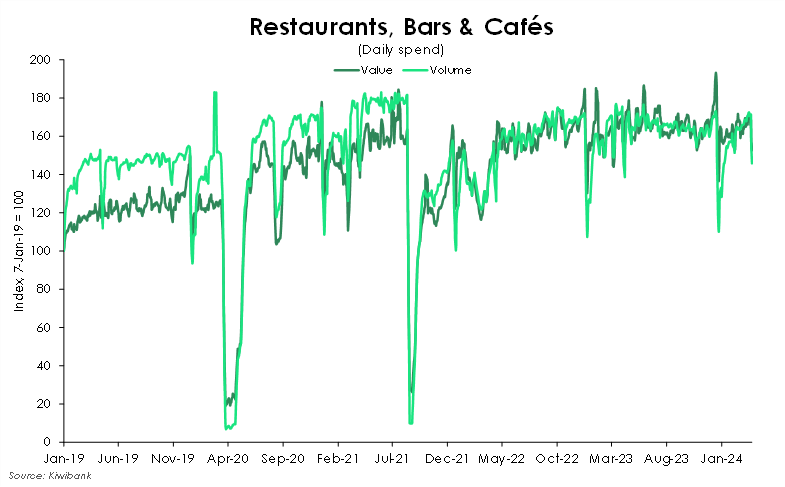
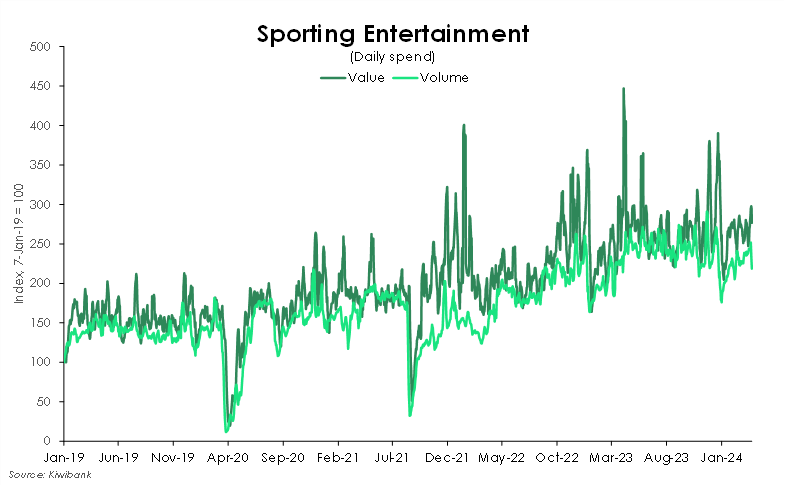
- New Year’s Day in January, Waitangi Day in February, and the Easter break in March. The festivities just kept coming in the March quarter, and so did hospitality spend. The value of spend at restaurants, cafes and bars is up around 2% from a year ago, while sporting entertainment is up 10%.
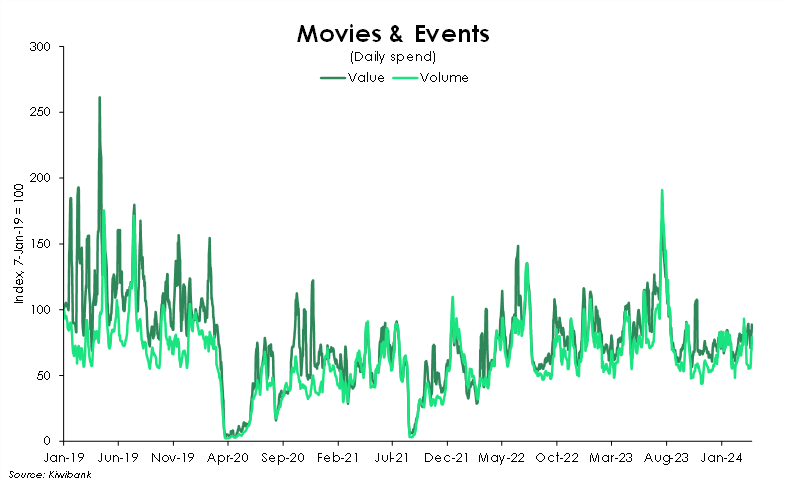
- For movies and events, the value of spend is down 3% on last year’s levels. However, the number of transactions increased 4.5%. It appears that Kiwi prioritised experiences over the holiday period – festivals, concerts, and sport events.
Bouncing back.
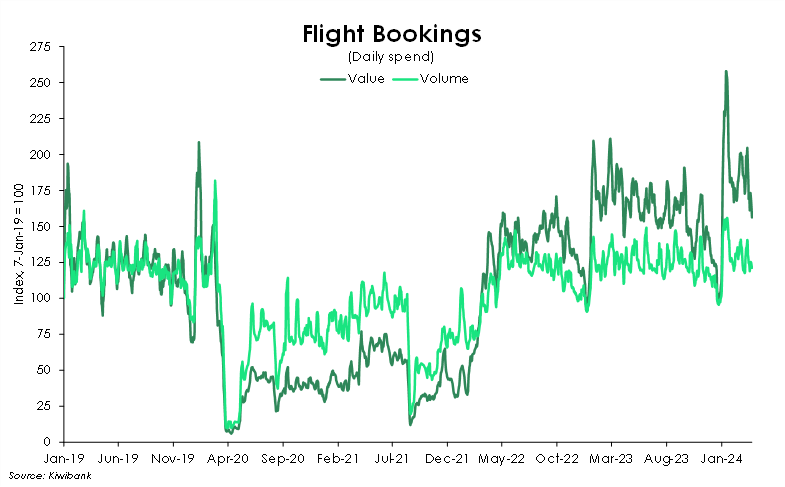
- Flight booking spend rebounded in the March quarter. After a 7.5% drop in volumes over the December quarter, spend jumped 10% at the start of the new year. Compared to last year’s levels, both the value and volume of spend rose. The number of bookings purchased is up 4.7%, albeit slightly outpaced by the 7% growth in the value of the bookings made.
Out and about.
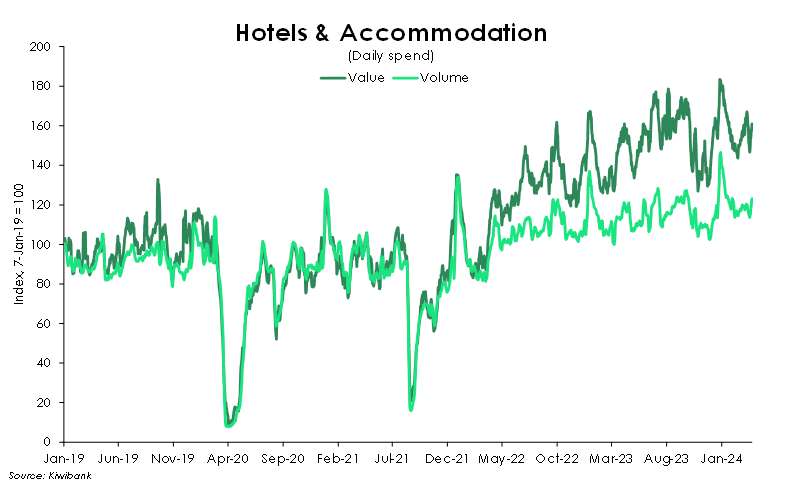
- Like flight bookings, spend on hotels and accommodation rebounded in the March quarter. Following a 5.8% drop at the end of last year, the volume of spend bounced 7% in the March quarter. Compared to 2023, volumes are up 9.3%.
- Volumes are largely tracking sideways, with a slight upward bias. However, the value of spend continues to climb. Monthly price data from StatsNZ has documented the seasonal rise in accommodation prices. And our data suggests the same. The value of spend is up 14.3% on last year’s levels. The spread between values and volumes continues to widen.
New year, new you.
- It’s a new year. And after a few weeks of indulgence, it’s time to get started on those new year’s resolutions. The March quarter saw a typical lift in the volume of spend on fitness services and gym memberships. Volumes are up almost 2% on the quarter and almost 3% in the value of spend.
Booklovers beat bookflation.
- For many, the end of the holiday period is typically marked by a trip to the stationery shop. However, spend this year was more subdued. It may be a sign of the times. Pen licenses are a thing of the past. Now it’s iPads, androids and kindles.
- Unlike most spend categories, the volume of spend has consistently exceeded the value of spend at Stationery and Book stores since 2020. Such divergence may suggest relatively inelastic demand. Bookflation topped 12.5% at its peak as publishers battled rising transport and paper costs. Stationery prices also did not stay stationary, with a similar rise. However, the volume of spend appears insensitive to changes in price as our data proves – up 5.3% compared the last year.
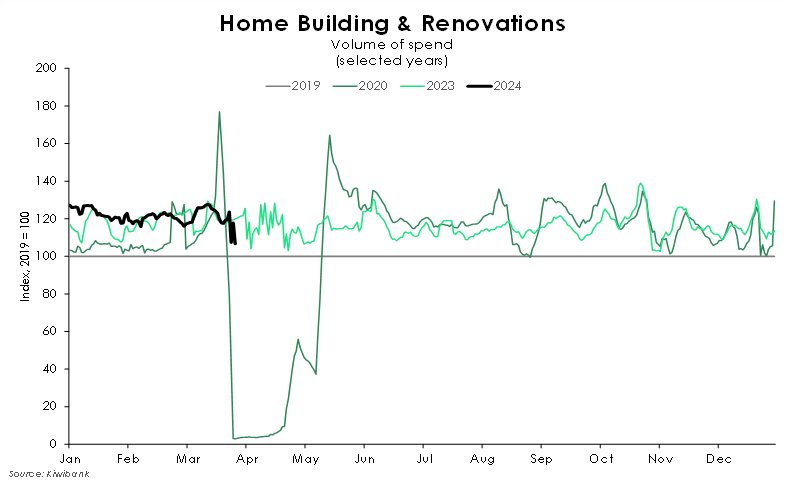
Signs of life.
- Weakness in housing-related spend continued over the quarter, but there were signs of life. The average monthly volume of spend on home contents and furnishings now sits around 0.2% below pre-covid levels. However, this is an improvement from 2023’s levels where the average monthly volumes were sitting 7% below pre-covid. The improvement is likely one driven by population growth as financial conditions remain tight. Migration is a double-edged sword. And the improvement in spend is evidence of the demand side at work. More people means more demand for everything, including retail.
- Consumer confidence has weakened, there’s little appetite for credit, and the housing market is struggling to sustain an upward trajectory. Households are just not in the mood to splash out on big-ticket items. Kiwi are spending less on the home and taking fewer trips to the hardware store.
March madness.
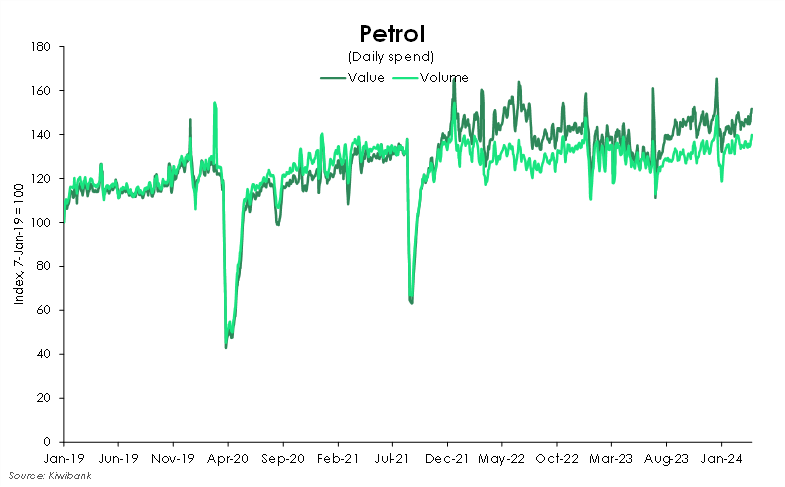
- Compared to last year, Kiwi appear to be taking more trips to the petrol station. The volume of spend is up 4.6%, but a moderation in global oil prices has seen a 3% decline in the total dollars spent.
- The gap between the value and volume of spend however will likely widen in the coming months. Recently, rising geopolitical tensions in the Middle East and OPEC+ production cuts have pushed up global oil prices in early April. Oil prices have since retreated after hitting a 5-year high but remain elevated. The dollar spend of transactions of petrol stations will likely inflate should the rally trickle down to prices at the pump.
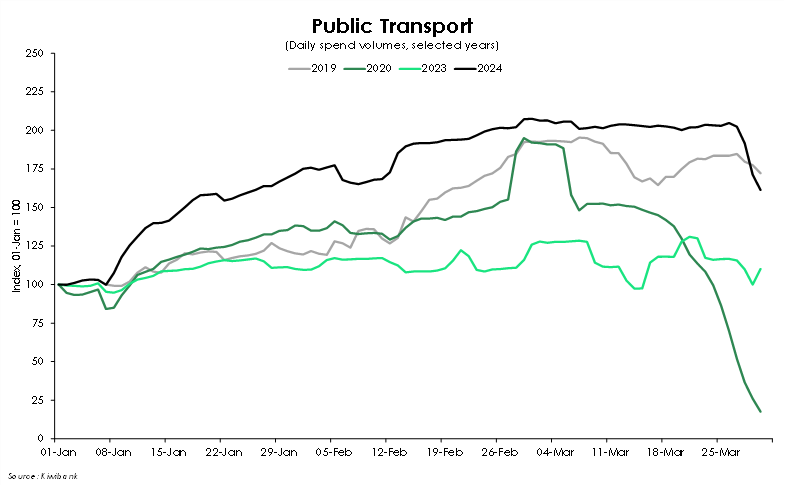
- For much of the quarter, workplaces were running skeleton crews and classrooms were still empty. The bus/train/ferry stations were relatively quiet without the usual commuters. Over January and early February, public transport spend was softer than usual. Compared to pre-holiday levels, the average number of transactions was down 8%.
- Demand typically ramps up into March with the return to work and study. Evidently this year’s March madness was the maddest since covid. And it began well before March. Both Auckland Transport and Wellington’s Metlink reported strong – even record-breaking – boardings. Our data shows an earlier and larger rise in the volume of spend. It follows rapid, migration-fuelled population growth. The good thing is, we now have the capacity to respond. The 80 automobile, bus and rail drivers that arrived pre-covid (2019) exploded to 642 over 2023!
- Going forward, we may see a level shift higher in the value of public transport transactions. The Government’s subsidised fare for certain age groups is set to end on April 30.