


- The Kiwi economy recorded a stronger than forecast 0.9% bounce in Q2 (Kiwibank +0.6%, consensus +0.4%). Business services generated the largest contribution to growth, accompanied by a lift in manufacturing output (following 5 quarters of decline). Economic activity was simply stronger than expected.
- Spending from households surprised a little on the upside, but was still weak. We saw a lift in the purchase of durables goods, and area of weakness in prior quarters. 140,000 new migrants entering the economy may have boosted spend in these areas, as they get established and set up homes.
- Let’s tell it for what it is: it’s old data. We have simply bounced off very low levels. Levels that were impacted by the flooding and cyclone. The full force of the RBNZ’s tightening is yet to come. And we continue to expect weak economic activity over the second half of this year, and into 2024. Today’s report does little to change our view on the path for policy.
New Zealand’s latest economic report card delivered some pleasant surprises. The impact of the flooding and cyclone was a little less in the upwardly revised first quarter, and we bounced back a lot stronger in the second quarter. It’s good news. We spent a lot more on services, especially business services, and real estate services. The bounce in business services and real estate services follows some very weak quarters prior. Government spending was also a large contributor. And after spending more of electricity, we found it in our budgets to lift spending on durables. Although all of these numbers are likely to have been inflated by the surge in migration. We saw 140,000 new migrants enter Aotearoa over the last year. We lost 40,000 Kiwis to greener pastures. But the net <100,000 gain boosts the demand for just about everything.
The weakness in the report came from the primary industries. There were sizable declines in agriculture, fishing and forestry, down 2.3%. The aftermath of the flooding and cyclones is still impacting supply in these critical areas. The other chunky declines were seen in retail trade, a familiar theme. We spent less on furniture, electrical and hardware retailing.
There was a lot of noise in the quarterly moves. To understand the underlying trend, it’s better to look at annual comparisons. And compared to the June 2022 quarter, economic growth slowed to 1.8%. That’s stronger than our estimate of 1.3%, but weaker than the previous 2.2% print. And we expect the slowdown to continue.
The Kiwi economy may now be officially out of recession. But that doesn’t mean we missed it altogether. Technically, the last quarter was revised away to -0.01%, from -0.1% (it’s all rounding). And we haven’t seen a material lift in unemployment. But we are not out of the woods. The last 9 months have been weak, regardless of the upward revisions. And it’s all about the outlook, not data from 3 months ago.
What hasn’t changed, is the RBNZ’s heavy hand. 525bps (5.25%pts) of interest rate hikes in a very short space of time, are still being felt. Many households have yet to be hit by much higher interest rates. They will be hit in coming weeks and months. The brunt of the slowdown is yet to come. We’re forecasting further falls over the year ahead. And monetary policy will have to be loosened before long.
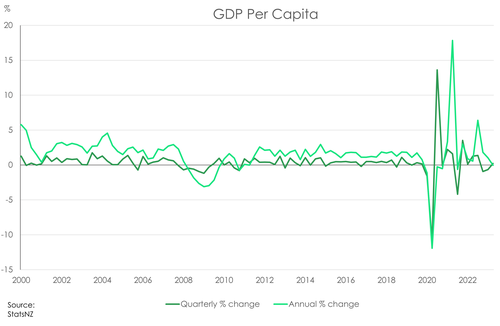
For the average Joe or Jane, their slice of the economic pie expanded a little, after shrinking in prior quarters. In Q2, per capita GDP growth recorded a small lift of 0.2%, having a deeper decline of -0.7% in Q1. That follows Q4’s -0.9%. Population growth has picked up the pace with the resurgence of migration. A boost to population will support output and consumption. But on a per capita basis, economic conditions are clearly bleak. It's likely we see a further slide in per capita economic output in Q3 and Q4.
 We expect further contractions in economic activity over 2023, and possibly into 2024. Demand is being weighed down by rising interest rates. If households spend less, which is what we are seeing, then the economy will contract harder. If businesses pull back on their hiring and investment, which is what we’re hearing, then the economy will contract harder.
Stonkingly strong services.
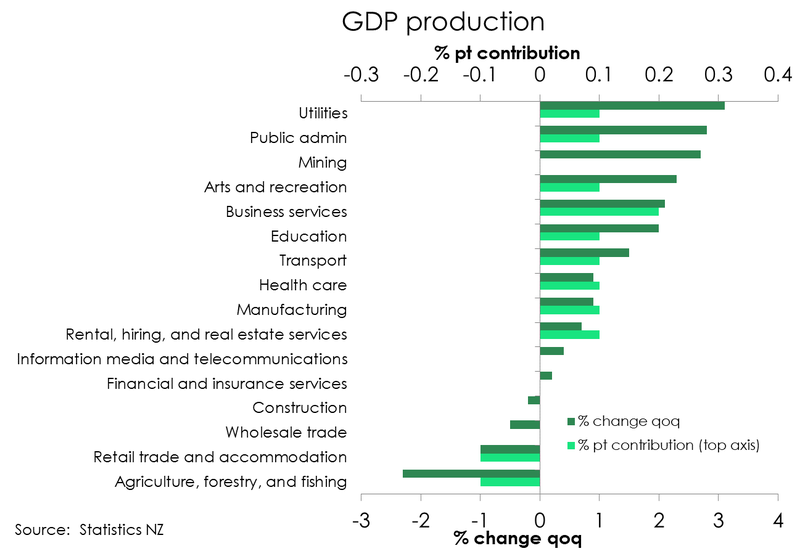
Services claimed top of the leaderboard, with activity growing 1%qoq from a -0.5%. With the exception of retail and wholesale trade, services were strong across the board. And it was business services that led the way. Activity bounced back 2.1% over the quarter (from -3.4%), adding 0.2%pts to total quarterly growth. The transport sector also posted a decent rebound from down 2.4% in Q1 to up 1.5% in Q2. The education sector rebounded from the 1.9% decline over the teach-strike-striken Q1, to a 2% pick-up in Q2. Offsetting these gains, however, was the persistent weakness in the retail sector. Retail trade and accommodation was the biggest drag on overall quarterly growth, subtracting 0.1%pts from overall quarterly growth. Retail trade alone declined nearly 2% in the quarter, the sixth-straight quarterly contraction.
At the bottom of the leaderboard, the contraction in activity across the primary industries deepened. Primary production declined 1.9% over the quarter. Breaking it down, activity in the agriculture, forestry and fishing sector declined a whopping 2.9%, the fourth straight quarterly decline, and far deeper than previous outturns. The wild weather has ended, but its impact is long-lasting. It appears that primary production is still struggling. The 2.3% fall in the agri space, was partially offset by the hefty 2.7% gain in mining activity, but not enough to lift the entire industry.
The goods-producing industries grew 0.7% over the quarter. Manufacturing rebounded strongly, while construction contracted further. That’s no surprise given a weak housing market and continued downtrend in new dwelling consents. According to Stats NZ, building activity was weak over the quarter. Seasonally adjusted, the volume of activity declined 0.1% from Q1’s (downwardly revised)
-1.7% reading. Residential construction activity dropped 2% over the quarter. Weak activity in the residential space follows the downtrend in dwelling consents. Compared to the March quarter, the number of new homes consented fell a seasonally adjusted 2.6%. And going forward, we’d expect further weakness in construction. Residential building activity is coming under pressure with a soft housing market and tough financial conditions.
Investment still the weak link.
On the other side of the same coin, expenditure GDP also rebounded – up 1.3% in the June quarter. The export of goods and services was up 5% over the quarter, largely driven by dairy and forestry exports. Somewhat at odds with the weakness in primary production. Household spending also contributed to the overall lift in expenditure. Household spending grew 0.4% over the quarter, meaningfully weaker than Q1’s 1.5% print. Spend on durable goods picked up the pace, rising 3.3% in the quarter alone. The work of net migration was likely at hand here, boosting aggregate household consumption.
Despite the overall lift, investment continues to be the weak link. Gross capital formation declined 4.3%, on top of last quarter’s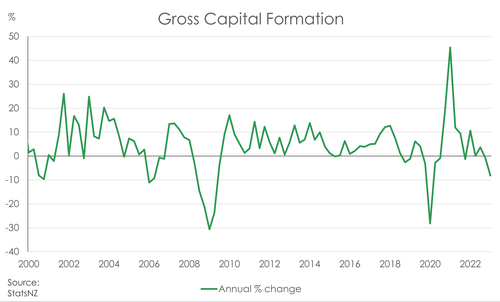 2.5% fall. The soft growth in construction activity was mimicked by weak investment activity. A slowing housing market has seen investment in the residential space pull back (-0.8%).
Also worthy of mention was the $1.4bn drop in inventory levels between the March and June quarter. Covid-related border restrictions prompted a shift in inventory management from ‘Just in Time’ to ‘Just in Case’. Inventory levels grew every quarter in 2022. Retailers and wholesalers are sitting on enough stock. But supply chains are normalising. And with the lift in exports and household spending means we’re eating into the built-up stock.
Growth ahead looks less rosy.
More important is the outlook, and it’s soft at best. Policy settings have been aggressively tightened. And the global backdrop is weakening, especially as China’s post-Covid recovery is losing steam. Against such a backdrop, our base case still involves NZ slipping into a recession later this year – albeit a shallow and short-lived one. There’s more and more hard evidence that domestic demand is responding to restrictive monetary policy, as intended. We don’t believe further hikes to the cash rate are necessary. We expect the RBNZ to keep the cash rate at 5.50% for the remainder of this year. Rate cuts will likely be the next move, but not for a while yet.
Special Topic: Current Account – June 2023 Quarter
Yesterday we saw the current account deficit (CAD) narrow significantly to 7.5% of GDP in the June 2023 year. Overall, the deficit isn’t turning out to be as bad as originally thought. The recent peak in the CAD seen in the December 2022 year was revised down from 9% to 8.8% of GDP. While the annual deficit in March 2023 was revised down from 8.5% to 8.2% of GDP.
With a lower starting point, New Zealand’s CAD surpassed expectations of narrowing to 8% of GDP. But at $29.8bn, the annual deficit remains $1.2bn wider than the year ended June 2022. Though compared with March, the CAD comes in about $2bn lower. And on a quarterly basis the seasonally adjusted deficit also narrowed by $1.9bn. That’s a solid move in the right direction and we should continue to see further improvements to the deficit from here. 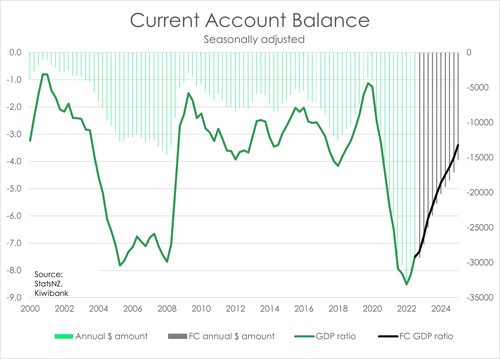
Compared with last year, two key drivers led the increase in the annual CAD. An ongoing widening of the goods deficit, and a further widening of the primary income deficit. Neither of which surprised. Historically low interest rates that followed the post-covid recovery saw good imports surge beyond average levels. On a year-to-year basis good imports were up $8.4bn. Though we are starting to see a turn as high interest rates continue to wash through the economy and constrain consumption. Annual good imports are down from $86.6bn in March 2023 to now $85.8bn. And we expect this move towards more sustainable levels of good imports to continue over the near term as high interest rates continue to drive down demand for imports. After all, we were the first to hike which means we could be the first to cut. As our interest rate differentials dissipate our attraction from foreign investors will dwindle. Especially ahead of a global slowdown. So, we expect some narrowing in the primary income balance to come ahead of rates cut next year.
And sands are already shifting in our services balance. Rebounding tourism has largely helped narrow the service deficit by $2.4bn in the last year. Tourism levels are noy yet what they were pre-covid, but we expect the rebound to continue and further relief to the CAD.