
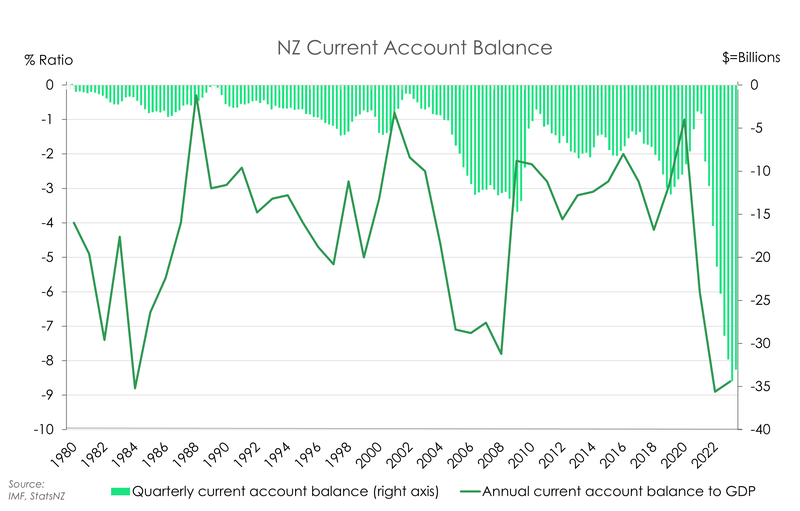
- Our current account deficit (CAD) has ballooned to 8.5% of GDP, with a recent peak of 8.9%. At a whopping $33 billion, our CAD is worse than ever. That said, the outlook is for a meaningful improvement.
- Covid hit us hard. Our largest export, tourism, was suffocated by border restrictions. And recent weather events have destroyed crops. Weaker global demand is also impacting prices. On the other side, imports surged post-Covid. But that will unwind.
- The good news is that there’s plenty of reason to believe that our current account will improve. We’re forecasting the CAD to narrow to 7.9% of GDP by year end, later narrowing to 6.3% in 2024 and 4.5% in 2025.
It is not unusual for New Zealand to run a deficit. A deficit tells us that more cash is going out overseas than what’s being generated at home. And that’s not always a bad thing. After all we are a small open economy. It’s expected that we draw more heavily on imports and spending abroad. But a deepening in our deficit post-Covid has raised some eyebrows. Particularly in concern with New Zealand’s credit ratings as S&P Global Ratings have warned on vulnerabilities surrounding persistent CADs.
Our short-term outlook doesn’t paint a pretty picture either. The IMF forecasts the CAD to remain at 8.6% for 2023. And if this is to be the case, that would make New Zealand the worst performer amongst advanced economies.
Historically, New Zealand runs at a CAD. We haven’t recorded a current account surplus since the early 1970s. And while our deficit usually sits at about 4% of GDP, we have been in similar situations before. Both in 1984 amidst oil shocks, and in the lead up to 2008, our current account deficit widened to 8.8% and 7.8% of GDP respectively. But in each of these times of price shocks and rampant expansionary activity, we’ve seen our deficit reined back in. For example, weak activity and lowered spending during the GFC saw the deficit shrink back to long-run average levels in about a year’s time.
So, in the same way, will the current slowdown of global and domestic activity help us rein in today’s deficit? We think so. Yes, it’s a double-edged sword. A slowing global economy can prove troubling. Softer trading partner growth can lead to less demand for our exports. But a cooled domestic economy will see import volumes fall as consumers pull back spending amidst higher interest rates.
Where did you come from?
When looking to draw conclusions on the severity of our elevated CAD, it’s important to step back and look at the origins of the recent surge. And the main driver has been a deteriorating trade balance. Both our imports and exports have faced turbulence amidst a range of disruptions over the past few years.
Unsurprisingly, our trade balance started worsening in 2020. Cue the start of the pandemic and the closure of the Kiwi border. Tourism took a severe blow, and we quickly lost our biggest export industry. Prior to the pandemic, tourism contributed to 20% of our total exports but this now sits at 2.4% of our exports. Combine this reduction in exports with the extensive monetary and fiscal stimulus in response to Covid-19, and we quickly ended up in an overheated economy. With excess purchasing power and a tightening labour market (thanks to a shut border) it wasn’t long before we were importing beyond our means.
More recently, the extreme weather events seen across New Zealand, in particular the damage of Cyclone Gabrielle on agricultural crops, depressed our trade balance. And despite a marginal rise in our goods export volumes in the March quarter,
particularly in dairy and meat products, the global weakening of commodity prices has not helped our case. Dairy and meat prices fell 9.7% and 12% respectively in the March quarter.
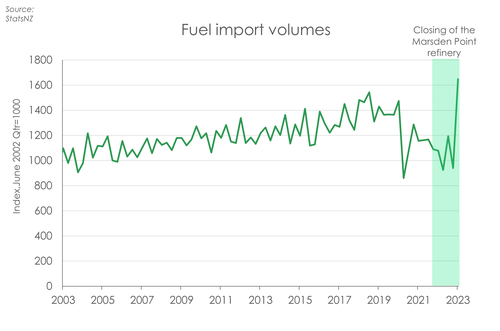 And while our surging import bill has largely been a result of an overheated economy, there has been some structural changes to our fuel imports. With the closing of the Marsden point refinery, fuel imports, which were up 75% in the last quarter, are likely to remain at new elevated levels.
Divergence in our income balance has also played a role in adding to our high CAD. While the March quarter saw a narrowing of our primary income deficit, on an annual basis, the deficit widened to $11.9 billion. It’s largely a result of relatively more aggressive monetary policy. The RBNZ has been a couple of steps ahead of the masses, hiking rates before most other central
banks. And with comparably higher interest rates we quickly caught the eye of foreign investors. Because after all, higher
interest rates mean a higher return. And more foreign investment means more investment income going abroad.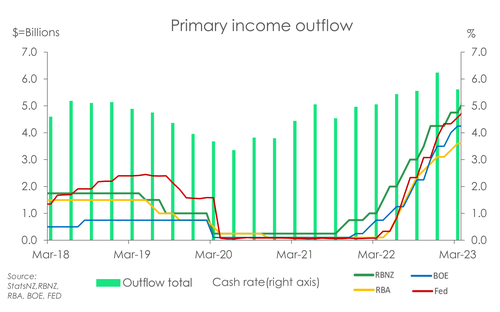
When will you go?
There are a lot of the drivers of our CAD. But the good news is that there’s plenty of reason to believe that a large portion of these are hangover effects from some unprecedented developments which should prove temporary. So, we’re expecting our CAD to improve. By year end we’re forecasting the CAD to narrow to 7.9% of GDP, shrinking to 6.3% in 2024, before making its way to 4.5% in 2025.
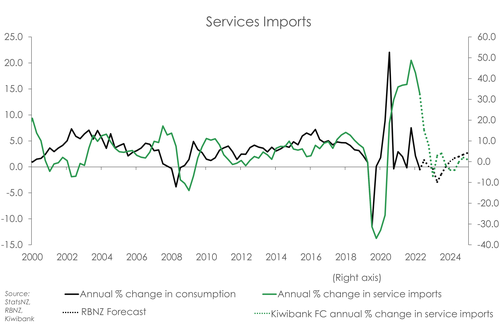
The era of closed borders is over. And rebounding tourism levels will help push up our exports. Short-term arrivals are running at about 70% of pre-Covid levels so there’s definitely room for some more upside. Especially since Chinese short-term visitor arrivals, our second largest market behind Australia, are only at 10% of 2019 levels. Such low levels are the result of China’s Covid restrictions which were not unwound 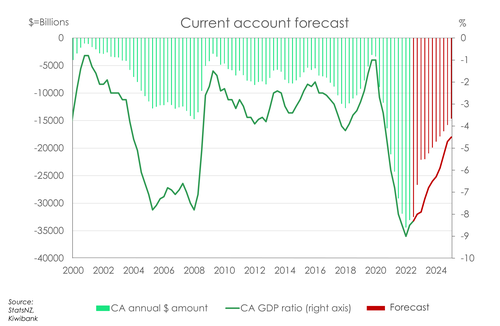 until earlier this year. But with airlines adding capacity across Asia, there’s signs of pent-up demand for travel. And we’re (finally) ready to service this demand. In part tourism’s slow recovery has been a consequence of capacity constraints and labour shortages. But the latest Kiwi employment data has shown employment in tourism-related industries are now back at pre-covid levels. So, likewise, we’re expecting travel exports to strongly rebound back to pre-covid levels over summer.
At the same time, interest rates from other countries are beginning to catch up to our peaked rate. And with that, our attractiveness to foreign investors begins to wane. We were the first to hike which means we could be the first to cut. And so, with more dwindling attraction from foreign investors, we expect more relief to come to our income balance and subsequently to the current account.
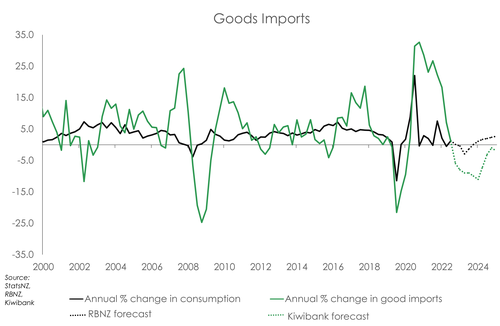
 We should also start to see reductions in our import levels with tighter monetary conditions taking the stage. The RBNZ has
struck with a heavy hand and hiked the cash rate 525bps since October 2021 to curb spending. We should see a wind down in demand for imports as the domestic economy cools and consumers, feeling the pain of high interest rates, cut back on spending. A falling kiwi dollar, which we forecast reaching 55c year end, will also help our trade balance. A lower bird helps boost our exports by making them more competitive and weakens demand for imports as they become more expensive.
 We’re already seeing some upside to our merchandise trade balance. In the June quarter our goods exports rose by 4.3%
following a 3.8% fall in March. Meanwhile our goods imports fell 6.9%. On a year-on-year basis, the merchandise trade deficit for June 2023 was $16 billion compared with a deficit of $11 billion in June 2022. But the merchandise deficit narrowed from $5 billion in March to $2.7 billion in June. That’s big and shows signs of weakening domestic consumption. Consumption leads imports, usually by about 3-4 quarters and the RBNZ forecasts the annual change in consumption to continue falling through to March 2024. So, we should see imports trough to more sustainable levels by around the end of 2024/ start of 2025.
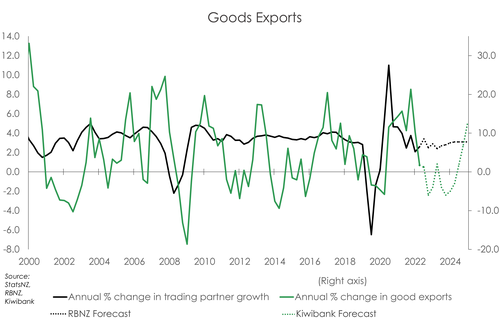 Our export growth on the other hand, may face some more difficulty amid the slowdown of global activity and weakening
trading partner growth. Again, trading partner growth leads exports, usually by about 3-4 quarters and the RBNZ has forecasted some weakening in trading partner growth until the end of next year. So, despite exports becoming more competitive through a lower kiwi, export growth may not see as strong of an uplift until the second half of 2025.
Box: Capital account 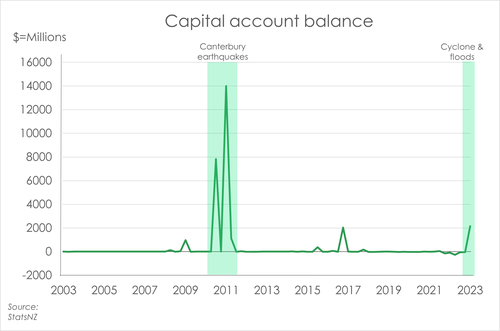
Unlike the current account, which shows a country’s net income, the capital account shows a country’s net change in investment and asset owners. In the March quarter our capital account recorded a $2.2 billion surplus up from a $46million deficit in December. But instead of coming from an increase in foreign buyers purchasing more of our assets, it was a lift coming from the effects of the cyclone and floods. Because of the extensive damage caused by these weather events, insurance companies had to rely on reinsurance companies overseas to meet the cost of their exceptionally large claims. Capital inflows surged in result. And so, to better acknowledge the extreme nature of these events and better reflect our economic position, these reinsurance claims have been recorded as capital transfers rather than current transfers. Just as they were during the Canterbury Earthquake sequence back in 2010-2011.