
“Forget me nots and second thoughts. Live in isolation. Heads or tails and fairy tales in my mind” Greenday
- The RBNZ delivered a crystal clear message in May. The OCR has peaked at 5.5%. And there’s a “very, very high bar” for further rate hikes. We believe the downside risks dominate, and cuts are more likely.
- We believe wholesale rates, and all lending rates including mortgage rates, have peaked. That’s an important message for Kiwi households and businesses. Interest rates are likely to fall from here.
- If the economy develops in a way we expect, then the RBNZ will start easing early next year. Financial markets are beginning to price in our long-held view. There’s downside risk to interest rates and the Kiwi dollar. Thinking through the risks is helpful for hedging.
The RBNZ has reached a pivot point and peak in the cash rate. Since 2021, the RBNZ has been hell-bent on dragging inflation back down to 2%. They have yet to achieve this, but they have done enough. That’s an important message for Kiwi households and businesses. We may have reached the peak in lending rates. And as with all peaks, we will come down the other side. Tailwinds are coming.
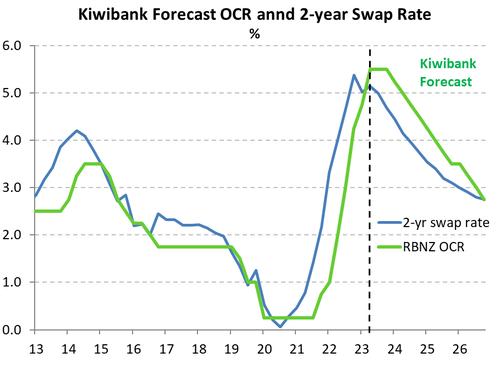
Our first chart plots the other side of the peak, the descent. The RBNZ lowered their forecast OCR track from the end of 2024, well below market pricing.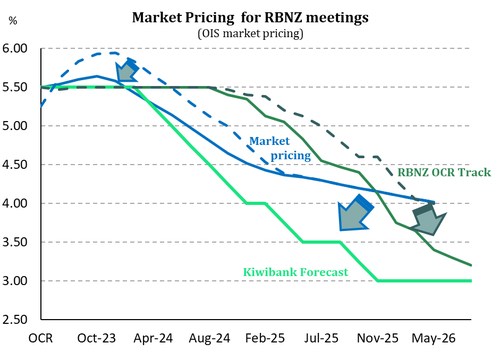 All lines have moved closer to our forecast track, which remains unchanged. Wholesale interest rates have dropped, with market expectations for the cash rate falling. We are likely to see further falls.
Lower wholesale rates feed into lower deposit and lending rates. If we are correct, we will see all interest rates declining into 2024 and beyond. The strong headwind that is rising interest rates, will turn into a tailwind later this year.
It’s incredibly difficult to pick the timing of future rate cuts. But our best guess is February next year. Our second chart plots rate hiking cycles back to 1999. The chart shows how aggressive the current tightening cycle has been. It also shows the RBNZ takes around 8-to-10 months to turn from hiking to easing. If the last hike was delivered in May, then our forecast cut in February is 9 months away. It is just a matter of time. And the sands of time are shifting. 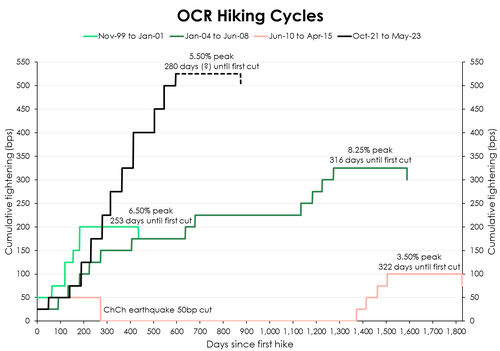
Interest rates tell you everything you need to know. And the interest rate curves are deeply inverted. Lower long-term rates reflect weaker expected growth and inflation. The inversion is a warning sign. Because curve inversions forewarn recessions, with a 9-to-12-month lead time. The Kiwi curve inverted in July last year. And we’ve recorded a recession already. Expectations of the next move in interest rates are lower. For example, the 2-year swap rate in one year’s time is 4.55%, 80bps below the current 2-year rate (5.35%). Rate cuts are priced.
The RBNZ hiked interest rates well into restrictive territory to restrain activity and inflation. The chart below illustrates the ‘neutral’ rate (neither restrictive nor stimulatory) – blue line – and the actual cash rate – black line. Our forecast OCR track is highlighted with the green dotted line. We expect to see a swift reversal over 2024, and into 2025. 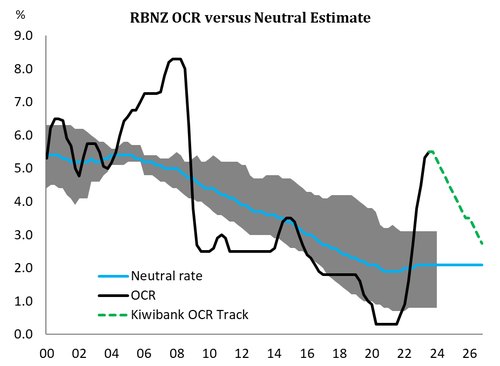
Our next chart plots the RBNZ’s policy stance (restrictive or stimulatory) and the shape of the Kiwi swap rate curve (2-year versus 10-year). The shape of the curve is largely driven by policy expectations. When interest rates are hiked to tighten policy, short-term rates rise faster than longer-term rates. And the further tightening goes, the greater the reduction in future growth and inflation, which pulls down long-term rates. The curve is said to flatten. And when it inverts, policy is arguably too tight, as recession risks dominate market psychology. 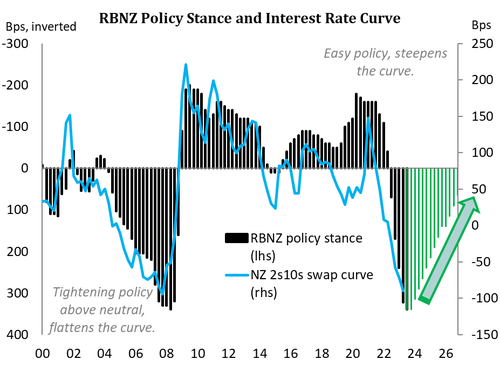
The curve was deeply inverted prior to the 2008 global financial crisis. During the crisis, rapid rate cuts saw the curve steepen quickly. Stimulus was needed, fast. Since 2009, policy has been broadly stimulatory. Policy was only returned to neutral briefly in 2014. And then we saw rapid rate cuts during Covid, to historic lows. Since the RBNZ started hiking late in 2021, the Kiwi swap curve flattened and then inverted last year. And we’re in recession, by RBNZ design. The curve will remain inverted until we see rapid rate cuts. And cuts are coming. When monetary policy is loosened to stimulate growth, short term interest rates are slashed. The curve is said to steepen. The next big move for the Kiwi curve, will be a massive bull-steepening.
Our central scenario sees a steady decline in the pivotal 2-year swap rate from around 5.25% at time of writing, to 4.7% by year-end 2023.The fall continues to 3.75% by year-end 2024, before hitting 3% by year-end 2025. That’s a meaningful move to neutral. And mortgage and business lending rates will head lower. This time next year, we expect the 1- and 2-year fixed mortgage rates will regain their ‘favoured’ status as the most attractive options. Offered rates could fall from today’s 6-to-7% range, back into the 5-to-6% range this time next year, with further downward moves into 2025. As we have said, tailwinds are coming. We forecast a massive swing in the 2s10s curve from a bottom of around -100bps, back towards positive territory.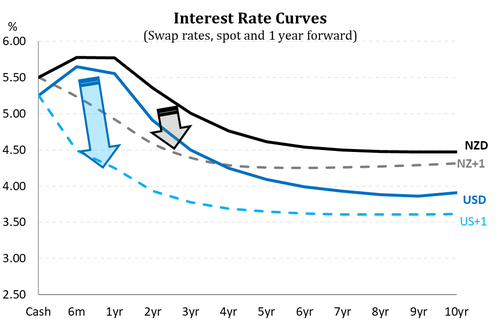
Brain Stew: the downside risks outweigh the upside.
“My mind is set on overdrive. The clock is laughing in my face. A crooked spine. My senses dulled. Passed the point of delirium.” Greenday
There are risks to both sides of our forecast. Upside risks may force the RBNZ back into the fray, to hike again. And then there are downside risks, which will dominate in our view.
“…higher net immigration, a slower decline in house prices and higher government spending are offset by the lower starting point level of GDP and consumer price inflation as well as a more negative outlook for our goods exports.” (RBNZ MPS, May 2023)
The upside risks to migration and Government
spending have engulfed the airwaves, with many commentators calling for more hikes. We disagree.
If net migration surprises on the upside, and generates more inflation, then further hikes might be necessary. We have seen an outsized +72,000 in net migration over the last year. And that number is likely to balloon to +100,000 in coming months. See our write up here. The surge surpassed our optimistic forecast of +35,000. But most of the spike in migration was pent-up demand. Migrants who would have come here over the last few years, but couldn’t due to border restrictions, are coming now. We think migrant flows will naturally fall back. And so does the RBNZ. “The big surge in immigration is behind us” RBNZ Governor Orr. 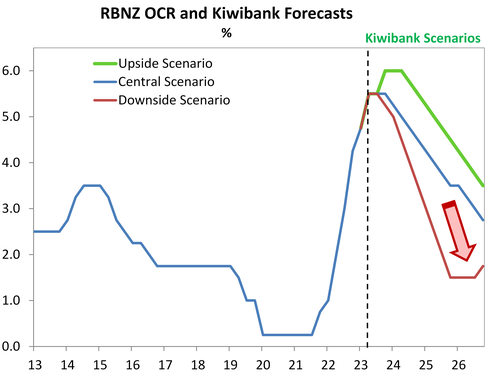
Faster population growth increases demand for just about everything. Migrants take rentals or buy houses, putting upward pressure on rents and house prices. They also put greater demand on our infrastructure, health system and education. More people equals more demand. But they are also coming at a time of chronic staff shortages across most industries. Most migrants are aged between 20 and 40 and keen to work. Migrants boost the capacity of the labour force and put downward pressure on wages. The migrant boom may be less inflationary than many fear.
If the cyclone rebuild and Government spending proves too inflationary, then further hikes might be necessary. It is difficult to gauge how inflationary the rebuild will be. But it is likely to be less than initially thought. And fears of Government spending may be exaggerated, with continued underspend. The Government has struggled to get funds out the door fast enough. The economy is weaker, and spending hits at a time of reduced aggregate demand. So even upside risks, have downside potential.
If the upside risks come through, the RBNZ is likely to hike to 6%. If the RBNZ deems more tightening is required, over and above a very, very high bar, then 50bps will be required. The Kiwi curve will invert even further, and the currency will regain upward momentum. Mortgage rates, particularly the variable and shorter dated fixed rates, will push higher, and exert even more downward pressure on economic activity and house prices.
On the other side, there are more risks to the downside.
The data has clearly turned over the last 9 months. There was a big miss in the last two GDP reports. The RBNZ had picked a 0.7% gain in Q4. Instead, economic activity contracted -0.7%. And the RBNZ forecast 0.3% in Q1, and we saw -0.1%. Essentially, the economy is smaller than forecast. Inflation also massively surprised on the downside (6.7% vs RBNZ’s 7.2%), and was supported by the critical 2-year ahead inflation expectations (2.79%) falling back below 3%. Government tax revenues have come in well below forecast, with both GST and corporate tax undershooting. This is a significant downside surprise in the hard data. The downshift in the Govt’s coffers confirms the downshift in spending on Kiwibank credit and debit cards. Household consumption looks to be contracting. And confidence among businesses and households has soured. Demand is being weighted down by rising interest rates. 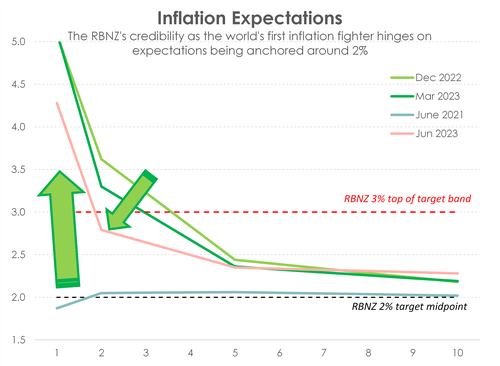
If households spend less, which is what we are seeing, then the economy will contract harder. If businesses pull back on their hiring and investment, which is what we’re hearing, then the economy will contract harder.
At the end of the day, it’s all about inflation.
Imported inflation is easing, but it’s homegrown inflation that concerns the RBNZ. Inflation is only forecast to fall below 3%, late in 2024. It’s still a long journey back to the 2% target. The good news is, we’re on the way.
The forecast slowdown will drive a loosening in the labour market. Add to that the migrant-led increase in labour supply, at a time when demand is turning south. We may see the unemployment rate rising to 5-5.5% in 2024. As the labour market loosens, its inflationary impulse will soften.
If the downside risks dominate, then rate cuts come sooner. We are already below market consensus. But we could easily see more downside risks developing, requiring an even more aggressive easing cycle. There is a risk the RBNZ is forced to ease rates by year-end, possibly in November. And we are at least 250bps above neutral. In other words, at 5.5%, the cash rate would need to be slashed through the 2-3% neutral range to become stimulatory. If the RBNZ must provide stimulus, then we could see +400bps of easing. Under the downside scenario(s), we would see a much faster fall in short-term rates, steepening the Kiwi curve. Lending and deposit rates would drop swiftly, and the Kiwi currency would fall faster. Our point here is that the risks to interest rates, and the currency, are asymmetric.
Longview: the Kiwi housing market will bottom, soon.
“Peel me off this Velcro seat and get me moving…” Greenday
The true litmus test for the housing market will be in spring. And we expect to see an uplift in confidence and activity. There are three drivers of the housing market. Firstly, the peak in interest rates should mark the bottom in the housing market correction. Falling mortgage rates will support confidence and activity. Secondly, the demand/supply imbalance will worsen. The surge in migration and the loss of dwellings at high risk in climate change will only exacerbate the housing shortage. And finally, the residential construction boom is ending. The number of dwellings coming to market will fall back from very high levels. The growth in demand, with a migration boom, will once again outstrip supply in coming years. All three drivers point to a strengthening housing market, and price gains.
Boulevard of broken dreams: the Kiwi dollar will fall for exporters, hurting importers.
“I'm walking down the line, that divides me somewhere in my mind. On the border line of the edge and where I walk alone.” Greenday
The Kiwi currency has lost a lot of ground following the RBNZ’s peak OCR announcement in May. And we expect to see further falls from here. We have left our long-held forecast for the Kiwi at 0.55c by year end (it’s not broke, so we won’t fix it). Softer export prices, weakening global growth, and compliant inflation, means lower interest rates, and narrowing interest rate differentials. 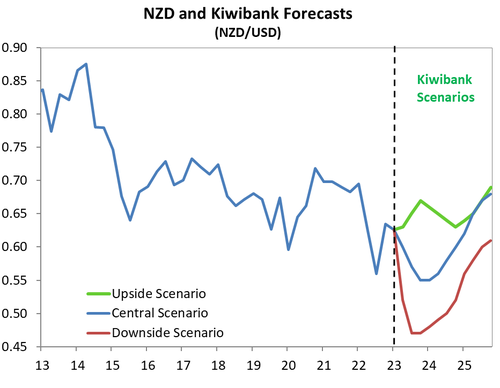
The Kiwi currency is driven by global risk sentiment, commodity prices and interest rate differentials – which incorporate relative economic performance. Global sentiment is fragile, with talk of recession in the US and Europe. And China’s growth has disappointed. Risk appetite is likely to weigh on the Kiwi dollar. Global commodity prices are easing. But our terms of trade remains well above longer term averages. Recessions in the northern hemisphere will see rates fall faster and deeper. And recessions in Aotearoa and Australia will see our rates markets outperform (lower interest rate differentials).
The fall in the Kiwi towards 55c will help offset weakening commodity prices for exporters. Unfortunately, a weaker Kiwi makes imported goods more expensive. We have factored in the softer Kiwi, and we still expect to see a helpful deceleration in imported inflation.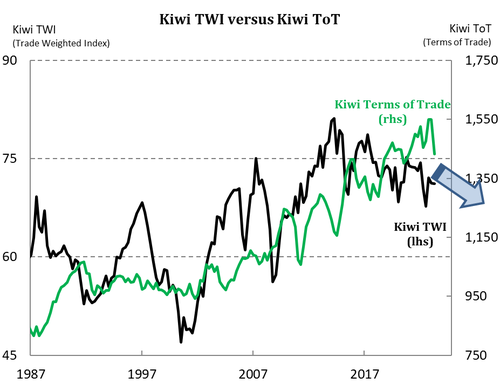
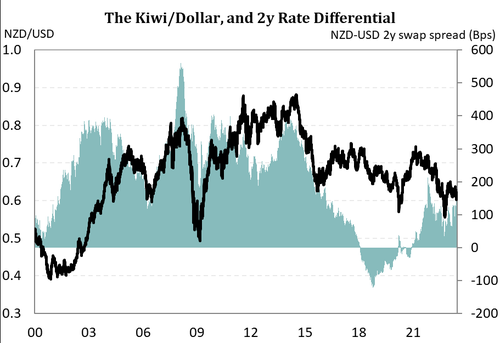
If you’re an importer, hedging exposures to a falling currency can assist. We suspect we have seen the top of the 2023 range, at 65c for the NZD/USD. We’re expecting a near term drop below 60c (currently 61c). Because expectations for US Fed (and other central banks) tightening will narrow interest rate differentials further. Ultimately, we see the Kiwi trading in a volatile 57c-to-63c range near term, before easing to 55c by year end. We are likely to see a 54c-to-57c range into year-end.
If you’re an exporter, 55c by year end will provide some offset for falling commodity prices. Be on the lookout for negative press, central bank jawboning and downside scenarios. Bad news can be good news for exporters.
For more detail on the Kiwi currency, please check out our “FX Tactical”. We include views from our traders.