

- The housing market failed to thaw in the first month of spring. The REINZ house price index was 8.1% down on last September. Sales were 10.9% lower on a year ago, the lowest annual fall since last July. However, last year’s delta lockdown distorted annual comparisons.
- We continue to forecast a 13% trough in house price falls by year end before a modest recovery. Risks though are skewed toward a deeper trough if the RBNZ follows through with bold interest rate hikes.
- In our largest centres there is a clear North Island/South Island split. Both Wellington and Auckland are now experiencing double digit falls in house prices. In contrast, house price falls have been far more modest in Canterbury and Otago to date.
High mortgage rates take a toll.
The rapid rise in mortgage rates continue to exact a toll on the housing market according to the latest market data from REINZ. A subdued start to spring with house sales down over 2% in September seasonally adjusted. On an annual basis, sales were 10.9% down on last September, the smallest annual fall since July last year. However, annual sales comparisons in September are distorted by last year’s delta lockdown. Delta temporarily held back activity, largely in the Auckland region. Data on house prices and median number of days to sell were more telling of the mood of the market. The REINZ house price index (HPI) posted its 10th consecutive monthly fall and house prices were 8.1% lower on a year ago – the largest annual decline since the GFC in 2009. The median number of days to sell a property in Aotearoa held steady at 49 days (seasonally adjusted). Still around 10 days above the REINZ average and indicative of further house price falls ahead. 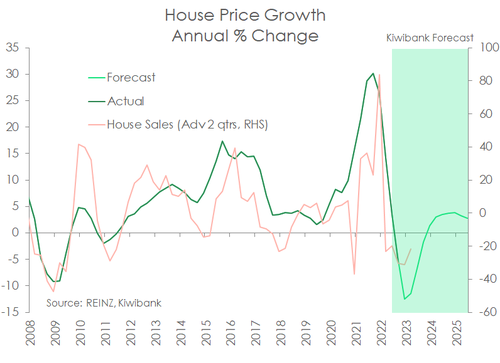
As we mentioned last week in our note on the RBNZ’s latest policy decision, risks are skewed toward the RBNZ doing more policy tightening than the 4% terminal official cash rate we expect. On house prices, we continue to forecast a 13% trough by year end before a modest recovery (see chart above). However, risks are skewed toward a deeper trough in prices if the RBNZ follows through with its bold talk of 75bp OCR hikes. Most outstanding mortgages roll onto much higher rates in the next 6 months. Meaning the fizzer of a start to spring may very well drag into summer – typically the busy period for housing activity.
Regional differences
While the mood in the housing market appears universally downbeat, the data does show differing experiences in housing markets across the country. When it comes to our largest centres, there is a clear north/south split.
The North Island has experienced the largest slide in prices to date. Wellington for instance leads the country with the largest house price falls in 2022. House prices are 17% down on a year ago in the capital. And the median days to sell a property in Wellington is tracking a whole 24 days above the REINZ average. The only bright spot was an almost 6% rise in Wellington’s median house price to $820,000. Auckland is also experiencing double digit annual house price falls at -11.2%.
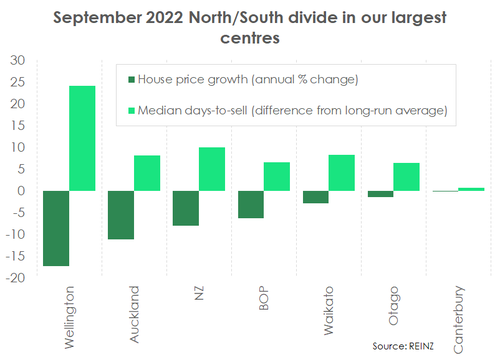 In Canterbury, sales activity has certainly cooled. However, the annual house price movement has only just ticked into negative territory (-0.1%). In another sign that the Canterbury market has more buyer interest than other parts of the motu, the median number of days to sell at 37 is only a smidgen above the region’s long-term average. Canterbury did not experience the excessive degree of exuberance seen in 2021 as in other parts of the country. In Otago, the HPI was largely flat in the month, and was only 1.5% lower than last September.