


We’re now short 130,000 homes
- This time last year we showed a shortage of 100,000 homes across New Zealand. Our population growth has outstripped housing supply, again.
- We’re now short 130,000 homes.
- The construction sector has boomed. Supply of homes has increased sharply. But we’re still falling short. Kiwibuild has yet to have an impact.
- With housing in such short supply, material house price falls are unlikely from here. Material house price gains are also unlikely in aggregate. But the regions will continue to outperform the cities, for a while yet.
The shortage is worse but should get better
In August 2018, we detailed the severe shortage of housing in New Zealand (see here). We developed a model that put the shortage at 100,000. Most of the shortage is in Auckland, where most migrants descend. Since then we have seen a lower trend in net migration, and the construction sector has started firing on all cylinders. Residential building consents have hit multi-decade highs. But as we said in last year’s report, the shortage was likely to get worse before it gets better. And the shortage has worsened, despite the industry’s best efforts to boost supply.
We’ve updated our model and our estimates now show a chronic shortage of around 130,000 affordable homes. If things continue the way they are, the shortage will balloon to 150,000 this time next year. However, the growth in the shortfall of housing in the last year was the lowest since 2014 (see chart below). So, things are getting worse, but at a better rate. Not really that comforting. But given the rising run-rate of building consents we expect to see a slightly smaller shortage next year.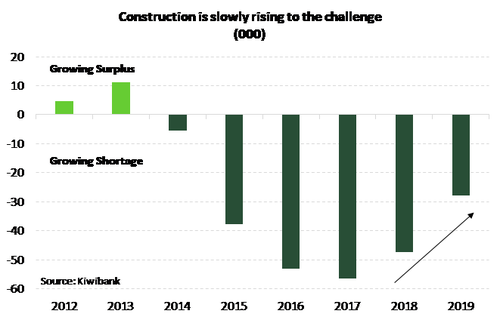
The bulk of the housing shortage is in Auckland, but many of the regions are feeling the pinch too. Auckland’s property market has proved to be a reliable, but loose guide for the regions.
The dramatic run up in Auckland house prices between 2012 and 2016 has filtered down into the regions. Because several cashed-up, or disheartened Aucklanders are moving for more affordable lifestyles. The great migration out of Auckland has boosted regional house prices. But the slowdown in Auckland will eventually feed into the regions.
Developments in the housing market have largely played out as we anticipated. Auckland has cooled, but not collapsed. Auckland house prices are down nearly 5% from the peak with more downside expected near-term. House sales have slowed across the country. And there has been a lack of listed property. Nevertheless, we don’t expect a major correction like that seen in Australia. Auckland’s housing market is in payback for previous excesses but remains fundamentally UNDER-supplied. A lack of housing supply is a key feature across NZ.
Government policy has weighed on investor activity (including: banning foreign purchases, removal of the negative gearing tax loophole, tightening the bright-line test), and affordability constraints are ever present. Auckland and Queenstown are feeling the effects of the restriction in foreign buying. Foreign buying has been largely understated for years. But the abolition of the planned CGT has lifted a major concern for investors. When combined with further interest rate cuts, we expect the housing market to lift between 5-6% over 2020-21. The regions are the star performers for now. Beyond 2021, we expect a more evenly distributed appreciation in prices.
One rising risk on the horizon, is the ratcheting up of bank capital requirements. Should the financial system experience a rationing in credit, as in Australia, then the wind will come out of the sails.
We love models, and we’re fixated on supply vs. demand
Our approach to estimating the aggregate shortage of housing is to look at the changes in the demand and supply of housing.
The supply side is relatively easy. We count the number of dwellings completed and use StatsNZ’s estimates of the total number of dwellings. The supply is a function of new dwelling construction, in addition to refits and restoration, and less the demolition of any dwellings.
The demand side, on the other hand, is harder to estimate. This is where we need to employ a bit of witchery. We look at StatsNZ population estimates, and model the changes in people per dwelling. We’re forced to assume the StatsNZ data are reliable… But basically, more people equals more houses. Just how many more houses depends on how many people we “want” per house. This year we decided to undertake more detailed analysis of the number of people per dwelling, and at the heart of this is demographic shifts. 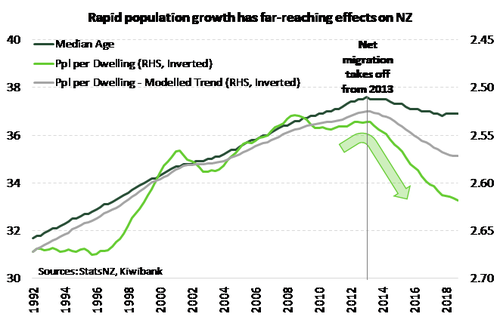
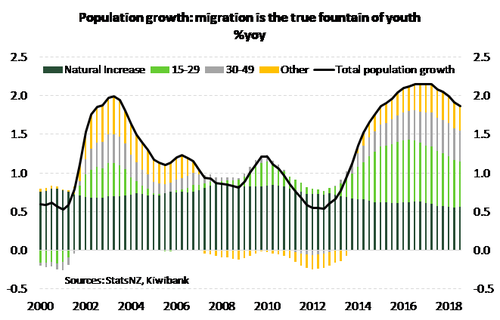
The recent surge in migration-led population growth is significant. Annual net migration peaked at just over 70,000 people in early 2017. Net migration is now broadly trending lower. But NZ is still feeling the effects of the past surge and continued gains. Well established demographic trends in New Zealand have been upended. Like most developed nations, the Kiwi population is aging. Post-war baby boomers are slowly making NZ’s population pyramid increasingly top-heavy. Consequently, the Kiwi median age had risen from around 31 years in the early 1990s and peaked at 37.7 in mid-2013. While a 7year increase in median age might not sound like much, it’s a step change in the world of demography. Surprisingly, since 2013 the steady upward trend was interrupted (see chart). The median age has drifted to just below 37. The fall coincided with our migration-led surge in population. Stronger net migration has lowered New Zealand’s median age. But that’s not always the case. After all, the last period of strong net migration (in the early 2000s) had no effect on NZ’s rising median age. Looking at the breakdown of immigration, it’s clear that the recent rise in population was dominated by younger age cohorts (see chart below), particularly compared to our last migration boom. Here is an example of migration truly being the fountain of youth! The young migrants also partially explain the dampening impact on wage growth. Unless you’re a young tech-savvy self-made CEO, it usually takes a while to rise through the ranks.
 Population trends are mirrored in the demand for housing. When NZ experienced a rising median age, the ratio of people per dwelling declined (see chart). Older households tend to be smaller – think “empty nests”. In contrast, children must share their home and younger adults are more likely to flock together to reduce accommodation costs – as any current or former scarfie would testify. When the ratio of people per dwelling falls, housing demand grows faster with population growth.
But NZ’s people per house is rising. NZ’s housing stock is working harder. In part, because of a jump in the number of younger people, happy to live together. But also relevant is where new migrant arrivals have come from, and what they are here for. A large share of recent migrant arrivals come from Asian countries (India, China and the Philippines) and are used to, and even prefer, higher density living. Also, many migrant arrivals over this period were here to study, no doubt occupying denser student accommodation. We have seen the ratio of people per house surge since 2013. As a result, housing demand may not grow as fast as has previously been the case. But demand is still growing.
We have re-estimated NZ’s housing shortage, with a more detailed demand model and with a year’s worth of new data. As we suspected last year, the picture has become worse but will eventually get better. Our estimates now show a chronic shortage of around 130,000 homes, up from around 100,000 last year. The shortage will eventually subside in time. Net migration is now trending down, and the rate of home building is slowly catching up.
The number of people per dwelling is not just driven by the age profile of households, or cultural preferences. Housing affordability, labour market outcomes, home construction rates, and short-term fluctuations in population, all play a role. Housing is still unaffordable for many. Labour incomes have experienced weak nominal growth. And our population run rate is still high.
Have the regions caught up?
A feature of the Kiwi property market, and economy in general, is the dominance of Auckland. And where property prices go in Auckland, the rest of the country tends to follow. It sounds like a generalisation, but trends don’t lie. For a few years now there has been a notable divergence between Auckland and the rest of NZ. Now large parts of NZ are playing catch up, as Auckland housing market activity cools and prices fall. Following a long period of exuberance, affordability in our largest city was stretched to breaking point. For many who wanted to get a foothold in the market, the price was too much to bare.
Looking at some of the regions closer to Auckland, such as Northland, Waikato and the Bay of Plenty we gain some insights. If someone is priced out of the Auckland market, then areas within commuting distance become viable options to live or invest. And there are truckloads of anecdotes telling of the migration of Aucklanders into the regions, from retirees to disheartened first home buyers. Mangawhai was the example we used last year. And the number of Auckland commuters and retirees living in the Northland town continues to grow, rapidly.
The exodus was also fueled by regulatory change, when the RBNZ singled out Auckland and tightened macro-prudential policy. It looked like a game of whack-a-mole, holding the Auckland market down only caused markets close to the City of Sails to pop up. Looking at indicators of heat in these markets, such as median days to sell and inventory of listed property, there is clear evidence of Aucklander buying in regions. And the move was completely rational, and incentive driven.
Investors hunt yield in a world of declining yield
Investors have a love-hate relationship with interest rates. When interest rates fall, the values of expected future cashflows rise. That’s why equity market valuations tend to lift when interest rates are slashed. It’s not too dissimilar in property markets. Mortgage rates have been slashed, and the required rental yield on property has fallen too. In Auckland’s case, the rental yield fell sharply as property prices took off well in excess of rental gains. Now, rental yields in Auckland are rising. Because property prices are falling, modestly, compared to a continued rise in rents. To an economist, the trends are pure poetry in motion. 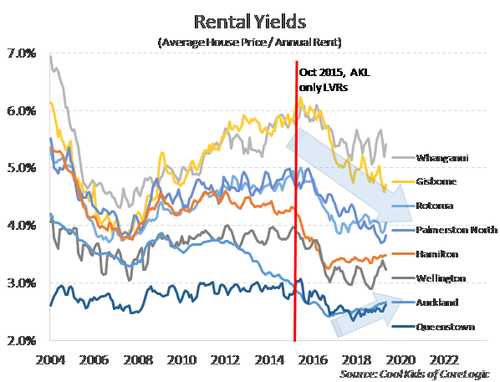
But what happens when prices rise too far, too fast, and rental yields fall too fast too fast? Well, you hunt for yield elsewhere. And when you’ve been hit with drastically higher LVR restrictions, the motivation to look outside Auckland becomes compelling. The rise in property prices, and fall in rental yields, outside Auckland is perfectly rational. And it was always expected with the introduction of the RBNZ’s ‘Auckland first’ LVR restrictions. The LVR restrictions are now national, so the catalyst is no longer there.
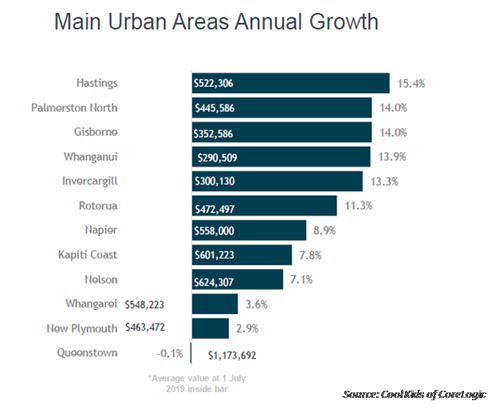
Last year, we highlighted the (ridiculously beautiful) rental yields in Whanganui. At 9%, according the REINZ data, Whanganui …. Now, only 1 year later, rental yields in Whanganui have dropped. Rents have risen. So yeah, prices in Whanganui have skyrocketed 14%yoy. The same can be said for the mighty Hawke's Bay, Gisborne, Palmerston North, Northland and other regions.
The cool kids from CoreLogic gave us rental yield data for the chart. It’s a lot smoother than the REINZ stuff. Queenstown has always been ‘expensive’ on a rental return basis (you can’t put a price on beauty). And so is Auckland after the big run down from 2012. The yield rich regions have stood out, and outperformed (in price) since the Auckland only LVR introduction in 2015.
 We expect the rental yields in the regions to continue to ease towards Auckland’s, but they’re unlikely to go below. We expect the premium on the largest city, with the most liquid and arguably the easiest access to remain. It’s a bit like saying, New Zealand needs to offer higher interest rates to attract foreign capital. We’re saying the regions need to offer higher rental yields to attract investors. Sounds reasonable. Only New Zealand no longer has to offer higher yields to attract foreign capital. That theory went out the window years ago. So, our thoughts around higher rental yields in the regions are fair, but not set in stone.
Interest rates will remain very low for a very long time
It wouldn’t be a property report if we didn’t mention interest rates. Let’s start with the RBNZ. We continue to expect another OCR cut to 1.25% in August. And we’re becoming increasingly convinced in the need for the RBNZ to continue below 1% to 0.75%. Our chart shows the current wholesale (OIS) pricing for the RBNZ (dotted blue line). A cut to 1% is factored into the curve. Therefore, a move to 1% is almost fully factored into 1 and 2-year swap rates (the rates banks use to hedge their fixed rate mortgage flow). And therefore, mortgage rates largely reflect the move also. So steady as he goes for now. Adrian Orr would have to cut below 1% to move mortgage rates much further. And even then, the RBNZ will get less bang for buck below 1%.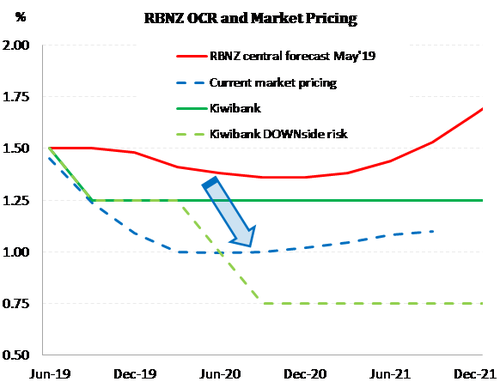
The pricing of lending rates will be impacted by banks starting to accumulate more (expensive) capital into 2020. The impact on interest rates is difficult to guestimate. The RBNZ see a low 20-40bps impact from the new capital requirements. Other market estimates are much wider at 60-120bps. The impacts on the economy will depend on how the additional margins are absorbed and spread between loans and deposits rates. Banks could lower deposit rates, and keep lending rates relatively unchanged. Or, banks could keep deposit rates relatively unchanged, and lump the full margin on higher lending rates. We’re likely to get a combination of both. And a segregation in rates offered is highly likely. The riskier the business, the higher the interest. So, if the RBNZ wants to keep lending rates broadly unchanged from today’s levels, more OCR rate cuts are likely, without adding much stimulus (if any at all).
The bank capital complication could crimp confidence if there’s a crunch in credit. We will likely see a combination of lower bank RoE’s, tighter credit availability, and wider banking spreads. OCR cuts can handle wider margins, but not credit rationing.
Construction has surged! But will it last?
At the start of 2019 construction activity has surged according to StatsNZ’s data on building work put in place. The volume of both residential and commercial construction activity was markedly higher over the March quarter. Commercial construction activity lifted 9%qoq, the largest quarterly jump since 2014 – the height of the commercial phase of the Canterbury rebuild – leading to an annual growth rate of 17%yoy. We know there is no shortage of building work at present as the industry plays catch up to a migration-led jump in population. But it’s unlikely the industry can sustain such stellar growth for long.
Capacity constraints are a major impediment to the sector and NZIER’s quarterly business survey shows builders capacity utilisation has been periodically punching survey highs since mid-2015. In March capacity utilisation was running at 94% among builders. Moreover, looking at other details of business confidence survey’s we have seen in recent months that building intentions have fallen off a cliff, particularly for residential construction. It looks as though capacity constrains are creating pinch points for future home building. There has also been a sharp contraction in home sales, centred on a subdued Auckland housing market. Building is correlated with housing market activity. A cooling housing market reduces the incentive to build and renovate. We expect that growth in residential-related construction will slow over the second half of this year followed by a modest recovery over 2020 to low single digit rates of growth. Mortgage rates are heading lower, investors don't have a CGT to worry about, and we still have a housing shortage to address.
Here’s what we’re forecasting.
With everything going on in the property market, we’re cautiously optimistic. Fundamentally, we don’t have enough affordable housing. The key word here is ‘affordable’. Because ‘unaffordable’ housing will help a few, but is unlikely to unlock the pent-up demand sitting within the rise in the people per household. We expect the city of sails to experience further price declines, in the magnitude of another 3-5% into 2020. But given the chronic shortage, continued population growth, and slow supply, prices should stabilise next year. Affordability issues will keep an anchor under future price gains thereafter. Across the fast-paced regions, we expect a significant loss in momentum into 2020/21. Across the nation, prices will rise a little this year. And we expected aggregated price gains to pick up towards 5-6% into 2021. It’s a mixed picture, as it was this time last year. And as it will still be this time next year. What we worry about, is the potential restriction in mortgage credit growth into 2020, as the banks prepare to load more capital. It’s easier to meet capital targets if you’re not growing as quickly. A likely outcome is a segregation in pricing and availability. One of the major banks has already singled out lending to indebted agriculture. Maybe we see more differentiation in pricing across new home buyers (lower rates), investors (higher rates) and high LVR (much higher rates).