- Our forecast for the Kiwi dollar is sharply unchanged at 55c by year end (if it aint broke, we wont fix it). And we have grown in our conviction. Falling commodity prices, narrowing interest rate differentials, and weakening risk appetite should see it through.
- In our last FX tactical in March, we introduced readers to the multiverse. That’s our way of highlighting the various scenarios surrounding any forecast. Now, we show how the downside risks are dominating the outlook. Importers beware.
- The major development in recent weeks has been the clarity of forecast from the RBNZ. Interest rates have peaked in Aotearoa, as they are still rising offshore. We stick out, calling for cuts. But that’s the risk.
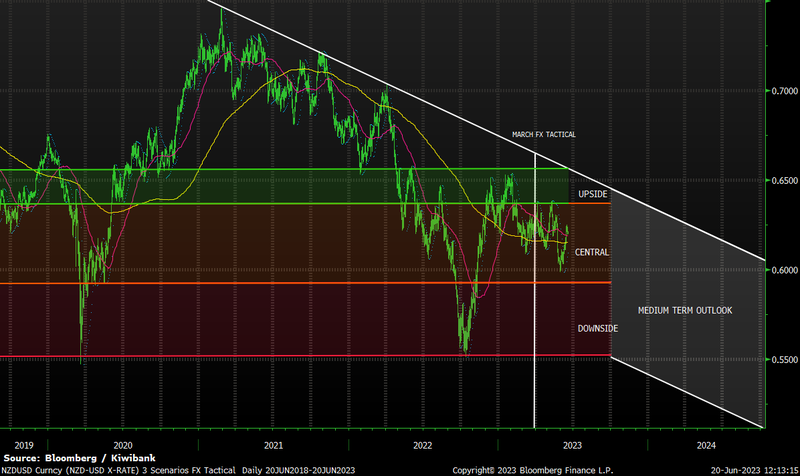
 Our first chart shows the channel that has developed for the Kiwi dollar. And it supports our long-held view that the Kiwi will fall further from here. Late last year, we forecast the Kiwi dollar to fall to 55c by year end. Most of the forecast decline takes place over the second half of 2023. Now we’re heading into the second half of 2023, and we’re expecting a meaningful correction lower.
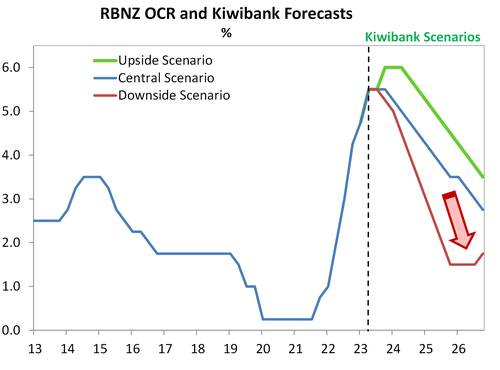
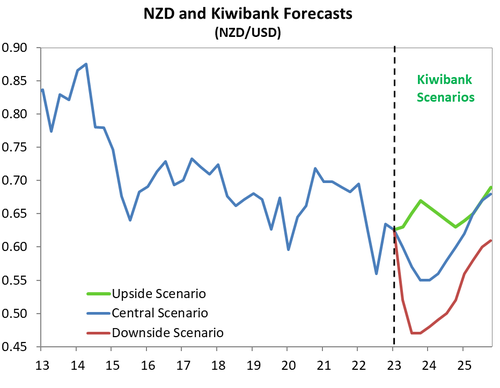 Our second and third charts plot the likely scenarios for the Kiwi cash rate and the Kiwi currency. We went through these scenarios on our last FX tactical in March. The scenarios remain the same, but we see the downside risks dominating. Our central scenario has a 55% weight, and a 55c target for the Kiwi. Our upside scenario, which we put a relatively light weighting of 10%, has some resounding strength in the bird up to 67c. Our downside scenario, with 35% weight, has a free-falling bird without wings and a possible 47c low point. Please note, we have increased the weight on the downside scenario (from 30% to 35%).
Given the Kiwi is currently trading at 62c, we see limited upside at 67c (10% chance), and deep downside at 47c (35% chance). When considering risk-reward, being short Kiwi makes sense to us.
For more details around our scenarios and the path of interest rates, see “Are we the waiting: the RBNZ’s prolonged pause will turn to rate cuts, eventually. Interest rates should fall.”
From the trading floor: hold onto your seats!
So what are the key changes we have seen? For one, locally, it looks like the RBNZ are done hiking. They indicated in their last MPS that the terminal rate is here at 5.50%, and now we are ready to look for rate cuts, but probably not until early 2024. The RBNZ have engineered a recession to get inflation under control, and they may potentially have done too much. As our Q1 GDP data showed last week, the Kiwi economy is at a weaker starting point, and we only see economic conditions deteriorating further from here. Key retail spending is lower, as consumers feel the pain from the massive tightening in interest rates. Business confidence is also significantly subdued. There is not a lot of upside in the tarot cards for the Kiwi.
Offshore, we have seen other central banks also get to the pause stage, but some are still playing catch up as inflation remains relatively high. While we are in the ‘disinflation zone’, those high rates of inflation are looking sticky. In the US, a strong labour market continues to keep the Fed with a hawkish outlook, despite having paused for now. Also the RBA and BoC both have done additional rate hikes, albeit only 25 bp, as inflation readings refuse to decelerate at a faster pace. Central banks globally remain inflation-wary, particularly in the Eurozone and UK, with both the ECB and BoE some way off the end of their tightening cycles, particularly the UK.
Another key change in global economics since our last tactical, is the outlook for growth in China. Following the easing of China’s Covid restrictions late last year, market participants were hopeful that the full reopening of China’s economy would help fuel growth, which would help to deliver a ‘soft landing’. But this is not to be, with China’s GDP looking lacklustre indeed. And the near-term forecasts aren’t looking any better.
From here we see further stagnation in growth. Strong NZ migration numbers will provide some relief, but not enough. Commodity prices are suffering under a lack of demand, and as we know, the antipodean currencies are very much commodity price linked. Credit conditions will also deteriorate from here. While the flare-up in banking contagion fears were relatively short lived, it was still an issue and will remain in the mindset for markets for some time to come.
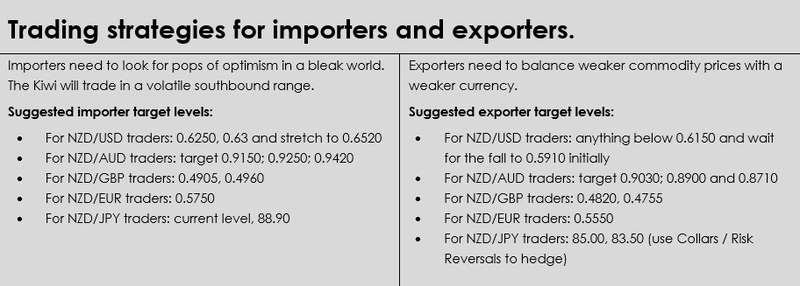
Our pick is that the Kiwi will head towards the 0.5700 level before the year is out, but it won’t be in a straight line. First off the bat we will need to crack the 0.5900 level. That may only be a matter of weeks away. Any upside swings for the Kiwi we would encourage importers to look at. Particularly any trades in the short term up towards the 0.6300 level. Complicating factors somewhat, include that the US Fed is now on hold. They have kept their options open for further tweaks to monetary policy settings, should they be required. But with the ECB still not at the end of their cycle we may see some upside for the Euro on occasion. As the Euro makes up the bulk of the basket of currencies that the US Dollar is measured against, this could force some further downside in the US Dollar, so upside to Kiwi. But we think this will be short lived. Hold onto your seats – we see a bumpy ride lower for the Kiwi.
Mieneke Perniskie – Trader
Since our last FX Tactical piece in March, there have been several major changes set into financial markets, but our overall medium-term view holds true. We still see the Kiwi dollar moving lower from here. We have recently seen the Kiwi touch on a low of 0.5985, before finding support again around 0.6140. A lot of this has been driven by a softer US Dollar of late.
Key Kiwi drivers.
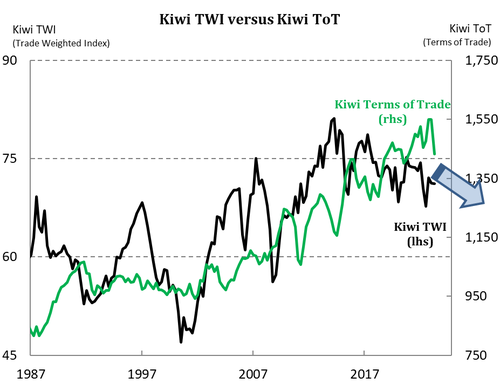
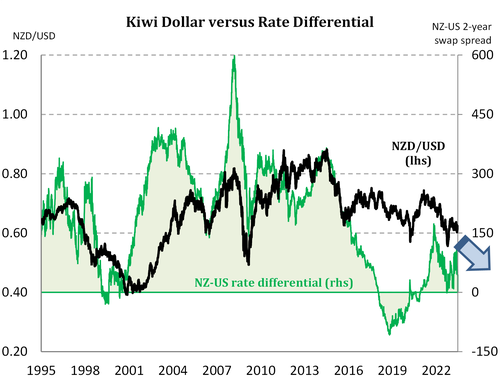
The next 3 charts highlight the key drivers of the Kiwi. Firstly, commodity prices are softening. The terms of trade points to reduced purchasing power for the Shaky Isles, and therefore weaker demand for the bird.
Secondly, interest rate differentials will work against the Kiwi, especially against the US. The RBNZ are done hiking. And there’s a “very, very high bar” for further rate hikes. Whereas the Fed have more rate hikes to deliver.
And finally, the “data surprise” in Aotearoa remains in negative territory. Put simply, the economic data has come in (well) below analyst forecasts. We expect this to remain a theme over the second half of the year. 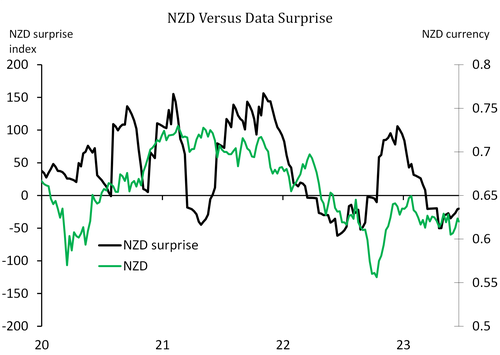
Kiwi crosses in the months ahead – Hamish Wilkinson, Senior Dealer
NZDUSD
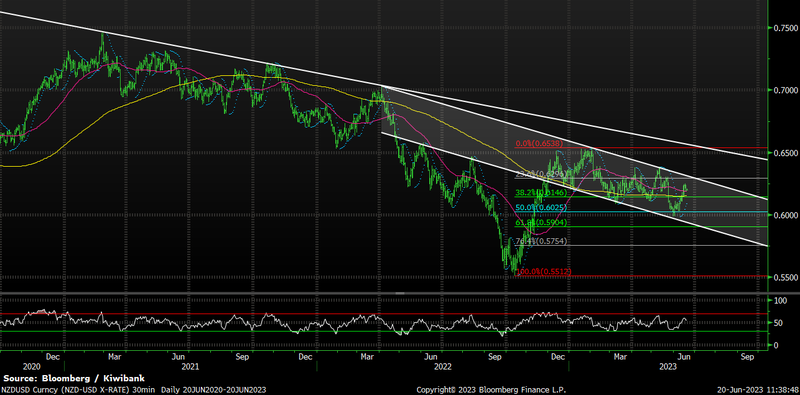
3-year daily – A breach of the reverse ‘head and shoulder’ support level at 0.6080 will prove to be a significant development in the last quarter. Despite the recent rally from below 60 cents, the technical picture remains bearish with a trend within a broader trend now developing. Upside resistance at 0.63 and 0.6520 are key levels for USD buyers to consider. Expect a retest of May low’s on the way towards the low 0.59s in the upcoming quarter.
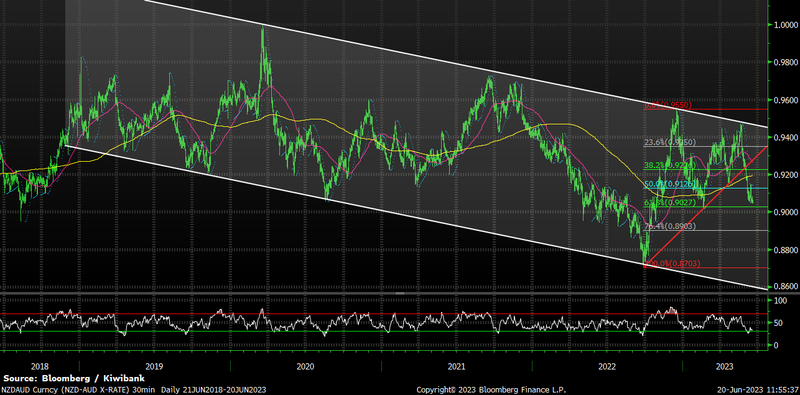
NZDAUD
5-year daily – March’s call of “further eventual downside” from the multi-year downtrend channel proves to be the exact outcome. The failure to break above 0.95 cents on the back of the RBA’s reversal in monetary policy stance now sees the 0.8703 – 0.9550 61.8% ‘golden pocket’ retracement level at 0.9027 under threat. AUD sellers should consider this level for short to medium exposures. Fundamentally we would now argue for an ultimate move towards the 2022 low on the break of 90 cents in coming months.
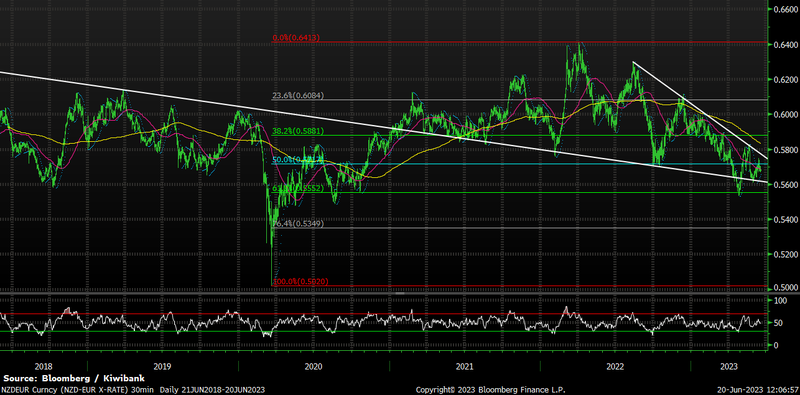
NZDEUR
5-year daily – The golden pocket in action! A false (for now) break of pivot support at 0.5650 finds eventual buyers at the longer term 0.5020 – 0.6413, 61.8% Fibonacci retracement level of 0.5550. The EUR outperformance of the past 3- 6 months driven by the ECB and BOE catch-up play to other “ahead of the game” central banks on interest rate differentials alone may now start to decay. However, with our broader downside NZ Dollar view, the technical picture continues to see downside risks as so long as 0.5750 (resistance) holds on the upside. 0.5550 will be key support in coming weeks.
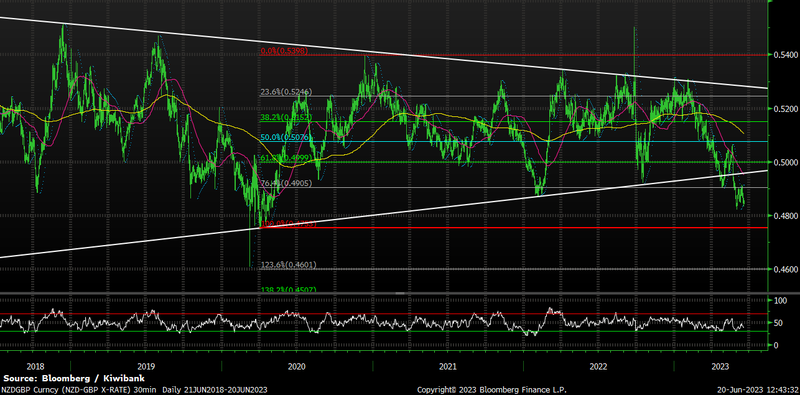
NZDGBP
5-year daily – The triangle is breached! Finding buyers at 0.4905 on the break of the downside triangle support, NZDGBP capitulates on aggressive BOE monetary policy action. With inflation still running hot in the UK, the BOE has no other choice to maintain an ongoing hawkish stance. Longer term this will hurt the UK economy, but for now the GBP benefits. Resistance at 0.4905 and then 0.4960, but expect a test of the recent low at 0.4822 prior to a move towards the 2020 low at 0.4753.
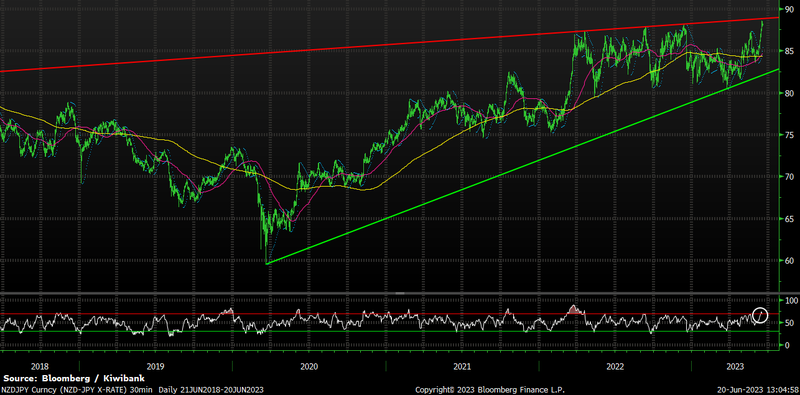
NZDJPY
5-year daily – It’s not all bad for the NZ Dollar! On the back of the BOJ continuing to maintain its ultra-accommodative yield curve control program, NZDJPY approaches a multi-month resistance zone. JPY buyers should consider this current level, whilst JPY sellers could consider optionality (Zero Cost Collars / Risk Reversals), as a potential hedge whilst enabling a downside benefit to any surprise BOJ change of policy stance.
Glossary
Commodity currencies: include the Kiwi dollar, Aussie dollar, Canadian dollar, Norwegian krone as well as currencies of some developing nations like the Brazilian real. These countries export large amounts of commodities (raw materials like oil, metals and dairy) to the world. And commodity currencies are highly correlated with the global prices of such commodities. When the global economy is strong and demand for commodities is high, commodity prices and thus commodity currencies, tend to outperform. The Aussie and Kiwi dollars are famously known for the sensitivity to good news (risk on) and bad news (risk off).
Interest rate differentials: The difference between the interest rates earnt on two different currencies. New Zealand may offer a significantly higher interest rate than those in Japan, for example, and we see an inflow of Yen into Kiwi dollars (known as the “carry trade”). The widening, and narrowing, of interest rate differentials can have a material impact on capital flows and therefore the exchange rate.
Monetary hawk (hawkish) and Monetary dove (dovish): Characterisations of central bank monetary policy. The hawk is a bird of prey and describes a central bank aggressively raising interest rates to slow economic growth and tame the inflation beast. The peace-loving dove however, reflects a central bank trying to stimulate economic growth by cutting interest rates.
Moving averages: A common method used in technical analysis to smooth out price data by showing the average over various time periods.
Reserve currency: The US dollar is the global reserve currency. The dominance of the US dollar in international trade means most central banks and financial institutions hold large amounts. The majority of FX reserves are held in US dollars. The US currency and debt markets are the most liquid in the world. And liquidity (the ability to buy and sell, especially in times of stress) is important. The next most traded currency is the Euro, but it is nowhere near as popular as the US dollar. About 60% of global reserves are held in dollars, with the Euro attracting only 20%, according to the IMF.
Support and Resistance levels: These are chart levels that appear to limit a currency’s price movement. A support level limits moves to the downside; a resistance level limits moves to the upside.
Terms of trade: The ratio of the prices at which a country sells its exports to the prices it pays for its imports. Put simply, terms of trade is a measure of a country’s purchasing power with the rest of the world. How many imports can be purchased per unit of exports – import bang per export buck. An increase in our terms of trade means New Zealand can purchase more import goods for the same quantity of exports. And a rising terms of trade lifts the incomes of exporters and the businesses and communities that support them.